Immigrants from Indonesia vs Immigrants from Cameroon 1 or more Vehicles in Household
COMPARE
Immigrants from Indonesia
Immigrants from Cameroon
1 or more Vehicles in Household
1 or more Vehicles in Household Comparison
Immigrants from Indonesia
Immigrants from Cameroon
90.0%
1 OR MORE VEHICLES IN HOUSEHOLD
68.8/ 100
METRIC RATING
160th/ 347
METRIC RANK
90.4%
1 OR MORE VEHICLES IN HOUSEHOLD
89.4/ 100
METRIC RATING
126th/ 347
METRIC RANK
Immigrants from Indonesia vs Immigrants from Cameroon 1 or more Vehicles in Household Correlation Chart
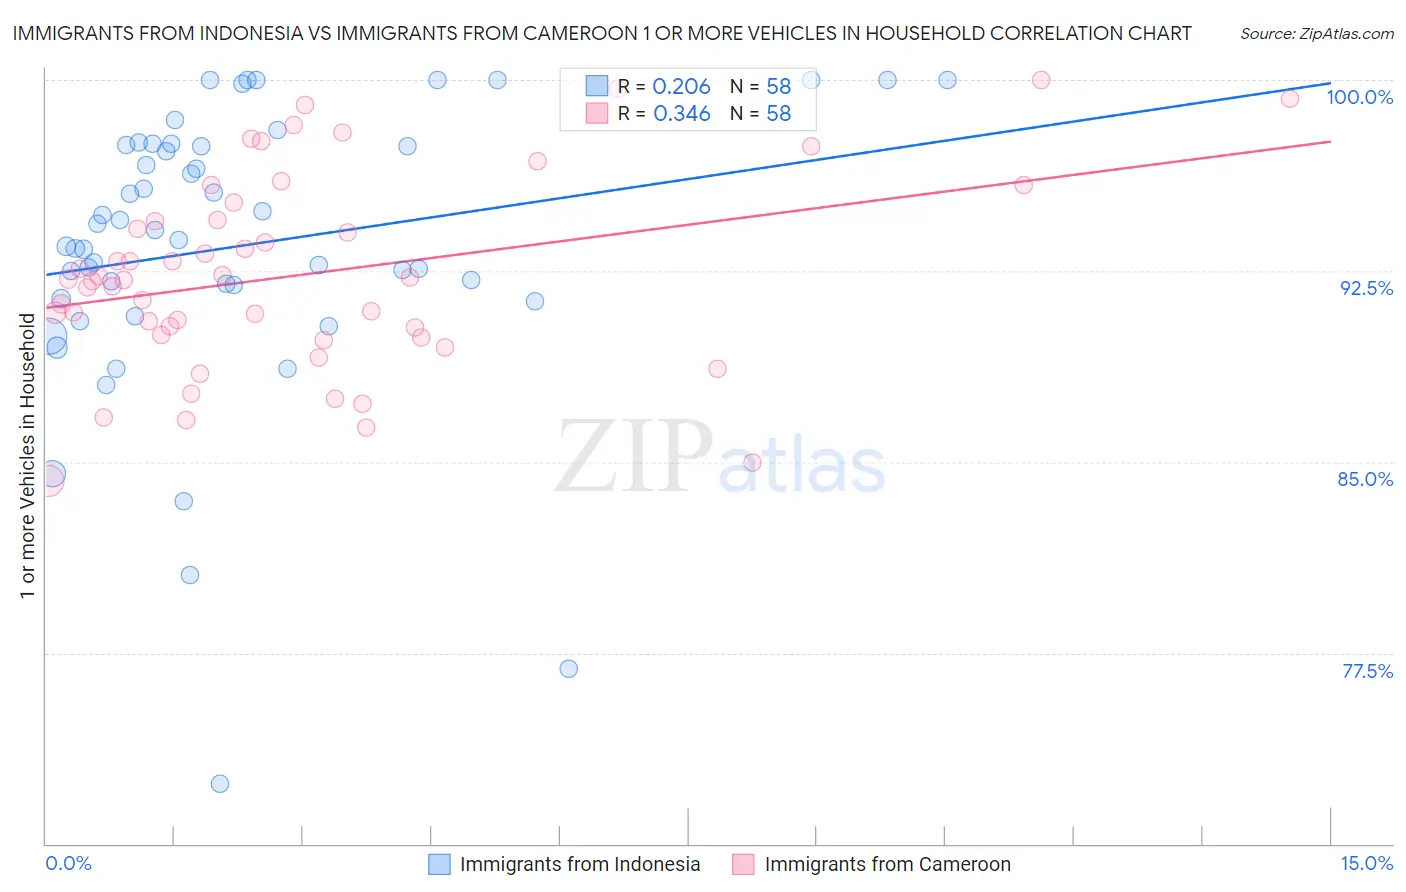
The statistical analysis conducted on geographies consisting of 215,621,131 people shows a weak positive correlation between the proportion of Immigrants from Indonesia and percentage of households with 1 or more vehicles available in the United States with a correlation coefficient (R) of 0.206 and weighted average of 90.0%. Similarly, the statistical analysis conducted on geographies consisting of 130,744,557 people shows a mild positive correlation between the proportion of Immigrants from Cameroon and percentage of households with 1 or more vehicles available in the United States with a correlation coefficient (R) of 0.346 and weighted average of 90.4%, a difference of 0.52%.
1 or more Vehicles in Household Correlation Summary
| Measurement | Immigrants from Indonesia | Immigrants from Cameroon |
| Minimum | 72.3% | 84.2% |
| Maximum | 100.0% | 100.0% |
| Range | 27.7% | 15.8% |
| Mean | 93.5% | 92.4% |
| Median | 93.9% | 92.2% |
| Interquartile 25% (IQ1) | 91.4% | 90.0% |
| Interquartile 75% (IQ3) | 97.4% | 94.5% |
| Interquartile Range (IQR) | 6.0% | 4.5% |
| Standard Deviation (Sample) | 5.6% | 3.8% |
| Standard Deviation (Population) | 5.6% | 3.8% |
Similar Demographics by 1 or more Vehicles in Household
Demographics Similar to Immigrants from Indonesia by 1 or more Vehicles in Household
In terms of 1 or more vehicles in household, the demographic groups most similar to Immigrants from Indonesia are Salvadoran (90.0%, a difference of 0.0%), South African (90.0%, a difference of 0.020%), Spanish American Indian (89.9%, a difference of 0.030%), Immigrants from Congo (90.0%, a difference of 0.040%), and Brazilian (90.0%, a difference of 0.040%).
| Demographics | Rating | Rank | 1 or more Vehicles in Household |
| New Zealanders | 73.8 /100 | #153 | Good 90.1% |
| Immigrants | Uganda | 73.8 /100 | #154 | Good 90.1% |
| Immigrants | Immigrants | 73.6 /100 | #155 | Good 90.1% |
| Australians | 72.4 /100 | #156 | Good 90.0% |
| Immigrants | Congo | 71.2 /100 | #157 | Good 90.0% |
| Brazilians | 71.0 /100 | #158 | Good 90.0% |
| South Africans | 69.7 /100 | #159 | Good 90.0% |
| Immigrants | Indonesia | 68.8 /100 | #160 | Good 90.0% |
| Salvadorans | 68.7 /100 | #161 | Good 90.0% |
| Spanish American Indians | 67.0 /100 | #162 | Good 89.9% |
| Immigrants | Austria | 65.5 /100 | #163 | Good 89.9% |
| Comanche | 63.4 /100 | #164 | Good 89.9% |
| Immigrants | Saudi Arabia | 62.6 /100 | #165 | Good 89.9% |
| Immigrants | Middle Africa | 62.2 /100 | #166 | Good 89.9% |
| Immigrants | Latin America | 60.3 /100 | #167 | Good 89.8% |
Demographics Similar to Immigrants from Cameroon by 1 or more Vehicles in Household
In terms of 1 or more vehicles in household, the demographic groups most similar to Immigrants from Cameroon are Immigrants from the Azores (90.4%, a difference of 0.010%), Burmese (90.4%, a difference of 0.010%), Marshallese (90.4%, a difference of 0.020%), Nicaraguan (90.4%, a difference of 0.020%), and Immigrants from Kenya (90.4%, a difference of 0.040%).
| Demographics | Rating | Rank | 1 or more Vehicles in Household |
| Blackfeet | 92.6 /100 | #119 | Exceptional 90.6% |
| Immigrants | Thailand | 92.3 /100 | #120 | Exceptional 90.6% |
| Icelanders | 92.1 /100 | #121 | Exceptional 90.5% |
| Costa Ricans | 92.0 /100 | #122 | Exceptional 90.5% |
| Fijians | 91.8 /100 | #123 | Exceptional 90.5% |
| Puget Sound Salish | 91.5 /100 | #124 | Exceptional 90.5% |
| Immigrants | Korea | 90.5 /100 | #125 | Exceptional 90.5% |
| Immigrants | Cameroon | 89.4 /100 | #126 | Excellent 90.4% |
| Immigrants | Azores | 89.1 /100 | #127 | Excellent 90.4% |
| Burmese | 89.0 /100 | #128 | Excellent 90.4% |
| Marshallese | 88.9 /100 | #129 | Excellent 90.4% |
| Nicaraguans | 88.8 /100 | #130 | Excellent 90.4% |
| Immigrants | Kenya | 88.5 /100 | #131 | Excellent 90.4% |
| Immigrants | South Africa | 88.1 /100 | #132 | Excellent 90.4% |
| Immigrants | Syria | 87.5 /100 | #133 | Excellent 90.4% |