Ecuadorian vs Yuman No Vehicles in Household
COMPARE
Ecuadorian
Yuman
No Vehicles in Household
No Vehicles in Household Comparison
Ecuadorians
Yuman
22.8%
NO VEHICLES IN HOUSEHOLD
0.0/ 100
METRIC RATING
329th/ 347
METRIC RANK
14.9%
NO VEHICLES IN HOUSEHOLD
0.0/ 100
METRIC RATING
300th/ 347
METRIC RANK
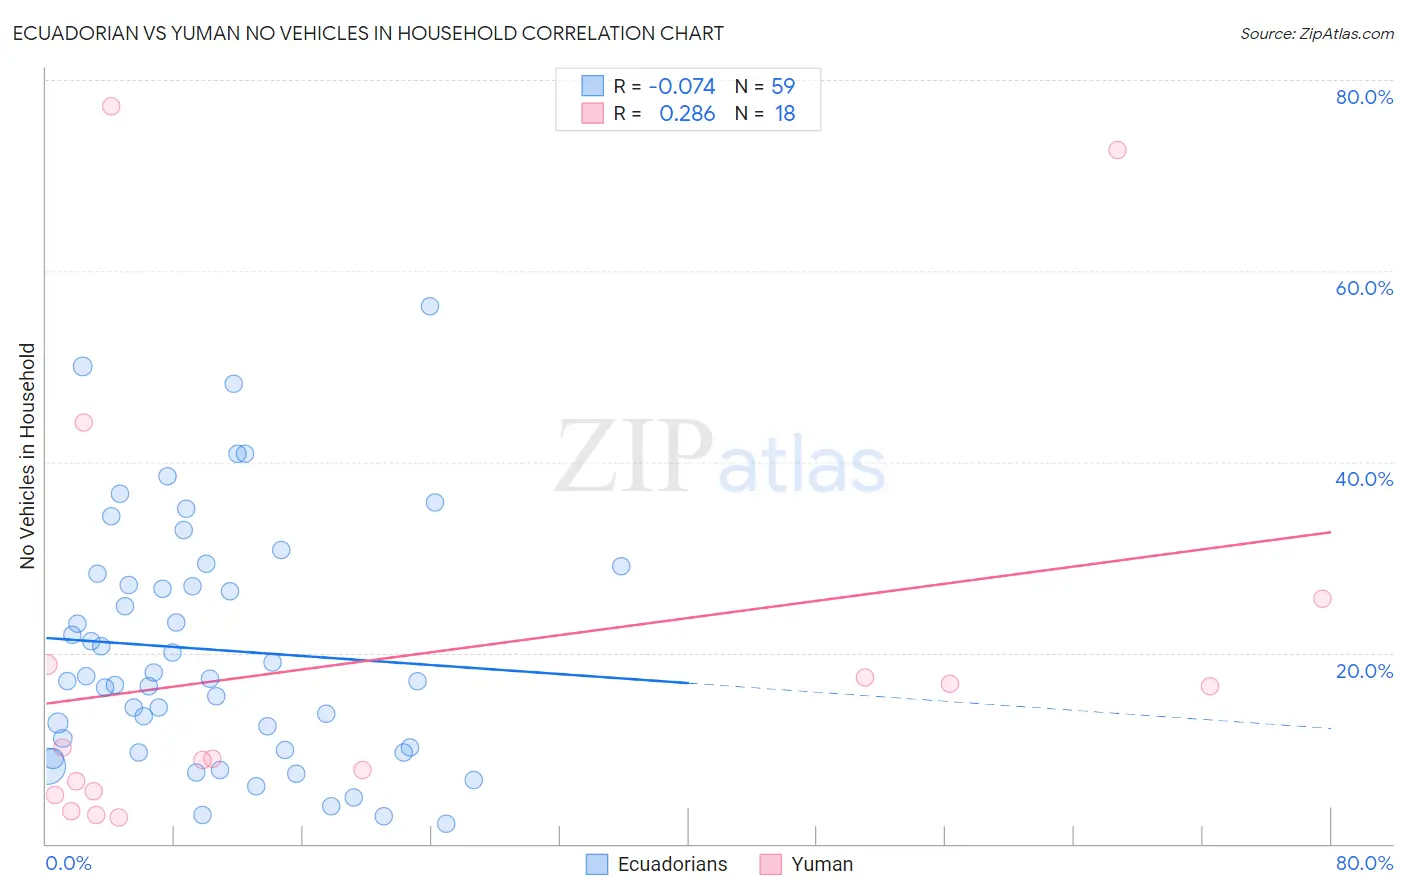
Ecuadorian vs Yuman No Vehicles in Household Correlation Chart
The statistical analysis conducted on geographies consisting of 317,233,310 people shows a slight negative correlation between the proportion of Ecuadorians and percentage of households with no vehicle available in the United States with a correlation coefficient (R) of -0.074 and weighted average of 22.8%. Similarly, the statistical analysis conducted on geographies consisting of 40,640,909 people shows a weak positive correlation between the proportion of Yuman and percentage of households with no vehicle available in the United States with a correlation coefficient (R) of 0.286 and weighted average of 14.9%, a difference of 53.2%.
No Vehicles in Household Correlation Summary
| Measurement | Ecuadorian | Yuman |
| Minimum | 2.1% | 2.8% |
| Maximum | 56.4% | 77.3% |
| Range | 54.3% | 74.5% |
| Mean | 20.3% | 19.5% |
| Median | 17.3% | 9.5% |
| Interquartile 25% (IQ1) | 9.8% | 5.5% |
| Interquartile 75% (IQ3) | 28.3% | 18.8% |
| Interquartile Range (IQR) | 18.5% | 13.3% |
| Standard Deviation (Sample) | 12.7% | 22.6% |
| Standard Deviation (Population) | 12.5% | 21.9% |
Similar Demographics by No Vehicles in Household
Demographics Similar to Ecuadorians by No Vehicles in Household
In terms of no vehicles in household, the demographic groups most similar to Ecuadorians are Immigrants from Dominica (22.2%, a difference of 2.3%), West Indian (23.7%, a difference of 4.2%), Trinidadian and Tobagonian (23.7%, a difference of 4.4%), Immigrants from Ecuador (23.8%, a difference of 4.7%), and Immigrants from Senegal (21.1%, a difference of 7.6%).
| Demographics | Rating | Rank | No Vehicles in Household |
| Immigrants | Cabo Verde | 0.0 /100 | #322 | Tragic 18.4% |
| Immigrants | Yemen | 0.0 /100 | #323 | Tragic 19.5% |
| Immigrants | Caribbean | 0.0 /100 | #324 | Tragic 19.6% |
| Senegalese | 0.0 /100 | #325 | Tragic 19.8% |
| Immigrants | West Indies | 0.0 /100 | #326 | Tragic 20.5% |
| Immigrants | Senegal | 0.0 /100 | #327 | Tragic 21.1% |
| Immigrants | Dominica | 0.0 /100 | #328 | Tragic 22.2% |
| Ecuadorians | 0.0 /100 | #329 | Tragic 22.8% |
| West Indians | 0.0 /100 | #330 | Tragic 23.7% |
| Trinidadians and Tobagonians | 0.0 /100 | #331 | Tragic 23.7% |
| Immigrants | Ecuador | 0.0 /100 | #332 | Tragic 23.8% |
| Immigrants | Trinidad and Tobago | 0.0 /100 | #333 | Tragic 24.6% |
| Immigrants | Bangladesh | 0.0 /100 | #334 | Tragic 25.8% |
| Barbadians | 0.0 /100 | #335 | Tragic 26.1% |
| Vietnamese | 0.0 /100 | #336 | Tragic 26.2% |
Demographics Similar to Yuman by No Vehicles in Household
In terms of no vehicles in household, the demographic groups most similar to Yuman are Immigrants from Ukraine (14.9%, a difference of 0.0%), Haitian (14.9%, a difference of 0.48%), Immigrants from Western Africa (15.0%, a difference of 1.0%), Immigrants from Greece (14.7%, a difference of 1.1%), and Moroccan (14.7%, a difference of 1.3%).
| Demographics | Rating | Rank | No Vehicles in Household |
| Immigrants | Jamaica | 0.0 /100 | #293 | Tragic 14.2% |
| Belizeans | 0.0 /100 | #294 | Tragic 14.3% |
| Paraguayans | 0.0 /100 | #295 | Tragic 14.4% |
| Immigrants | Spain | 0.0 /100 | #296 | Tragic 14.5% |
| Immigrants | Panama | 0.0 /100 | #297 | Tragic 14.6% |
| Moroccans | 0.0 /100 | #298 | Tragic 14.7% |
| Immigrants | Greece | 0.0 /100 | #299 | Tragic 14.7% |
| Yuman | 0.0 /100 | #300 | Tragic 14.9% |
| Immigrants | Ukraine | 0.0 /100 | #301 | Tragic 14.9% |
| Haitians | 0.0 /100 | #302 | Tragic 14.9% |
| Immigrants | Western Africa | 0.0 /100 | #303 | Tragic 15.0% |
| Immigrants | Russia | 0.0 /100 | #304 | Tragic 15.1% |
| Immigrants | China | 0.0 /100 | #305 | Tragic 15.2% |
| Immigrants | Belize | 0.0 /100 | #306 | Tragic 15.4% |
| Immigrants | Haiti | 0.0 /100 | #307 | Tragic 15.4% |