Eastern European vs Peruvian No Vehicles in Household
COMPARE
Eastern European
Peruvian
No Vehicles in Household
No Vehicles in Household Comparison
Eastern Europeans
Peruvians
11.7%
NO VEHICLES IN HOUSEHOLD
2.7/ 100
METRIC RATING
241st/ 347
METRIC RANK
11.2%
NO VEHICLES IN HOUSEHOLD
8.4/ 100
METRIC RATING
221st/ 347
METRIC RANK
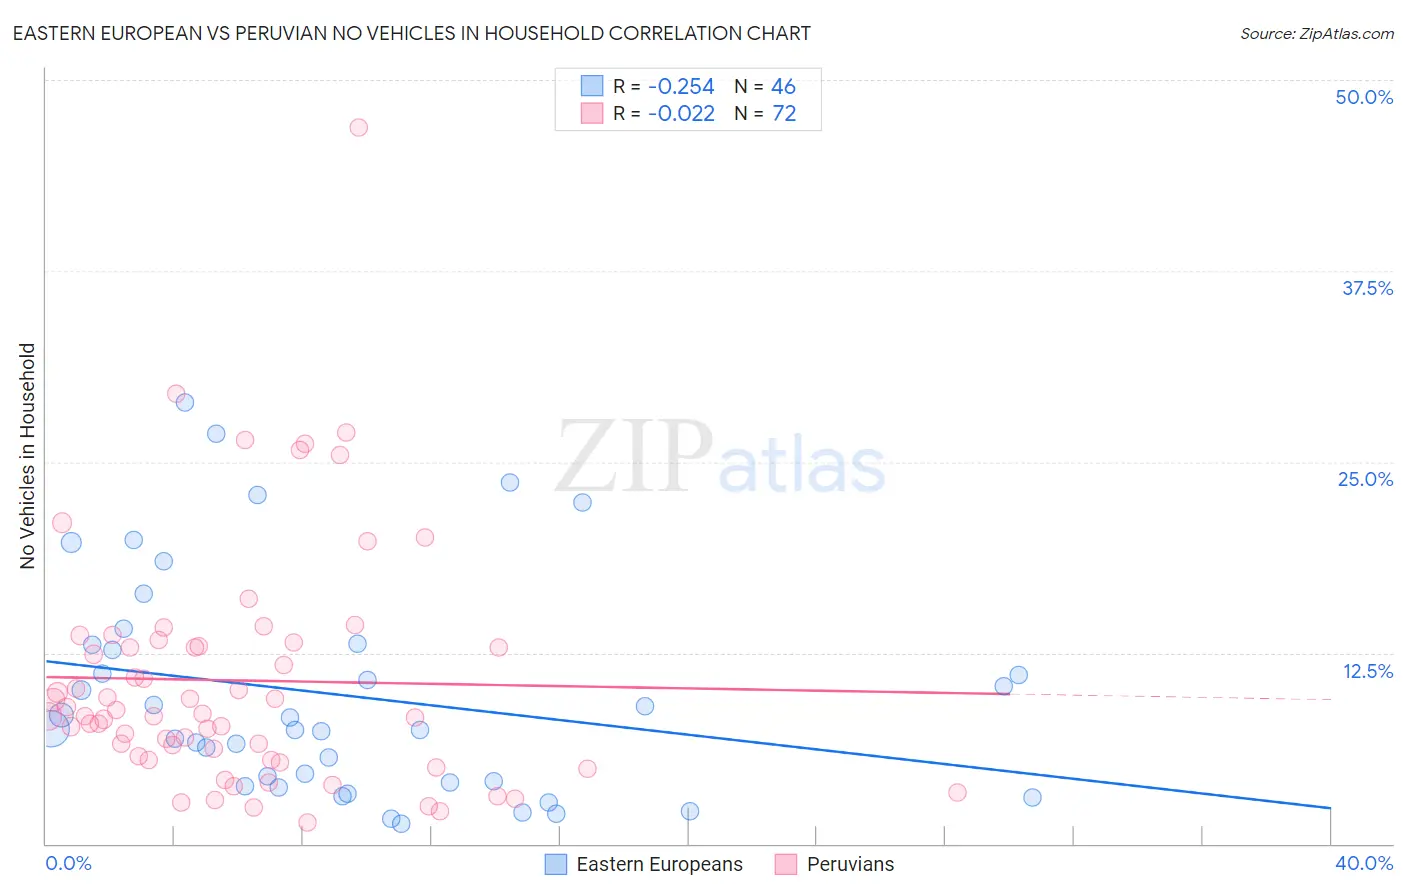
Eastern European vs Peruvian No Vehicles in Household Correlation Chart
The statistical analysis conducted on geographies consisting of 459,145,536 people shows a weak negative correlation between the proportion of Eastern Europeans and percentage of households with no vehicle available in the United States with a correlation coefficient (R) of -0.254 and weighted average of 11.7%. Similarly, the statistical analysis conducted on geographies consisting of 362,463,529 people shows no correlation between the proportion of Peruvians and percentage of households with no vehicle available in the United States with a correlation coefficient (R) of -0.022 and weighted average of 11.2%, a difference of 3.7%.
No Vehicles in Household Correlation Summary
| Measurement | Eastern European | Peruvian |
| Minimum | 1.3% | 1.4% |
| Maximum | 28.9% | 46.9% |
| Range | 27.6% | 45.6% |
| Mean | 9.7% | 10.7% |
| Median | 7.5% | 8.4% |
| Interquartile 25% (IQ1) | 4.0% | 5.6% |
| Interquartile 75% (IQ3) | 13.0% | 13.1% |
| Interquartile Range (IQR) | 9.0% | 7.5% |
| Standard Deviation (Sample) | 7.2% | 7.9% |
| Standard Deviation (Population) | 7.1% | 7.8% |
Demographics Similar to Eastern Europeans and Peruvians by No Vehicles in Household
In terms of no vehicles in household, the demographic groups most similar to Eastern Europeans are Immigrants (11.7%, a difference of 0.010%), Taiwanese (11.7%, a difference of 0.070%), Russian (11.6%, a difference of 0.53%), Ute (11.6%, a difference of 0.58%), and Cree (11.6%, a difference of 0.83%). Similarly, the demographic groups most similar to Peruvians are Immigrants from South America (11.3%, a difference of 0.15%), Uruguayan (11.3%, a difference of 0.30%), Immigrants from Hong Kong (11.3%, a difference of 0.52%), Immigrants from Sierra Leone (11.3%, a difference of 0.90%), and Immigrants from Somalia (11.4%, a difference of 1.5%).
| Demographics | Rating | Rank | No Vehicles in Household |
| Peruvians | 8.4 /100 | #221 | Tragic 11.2% |
| Immigrants | South America | 8.0 /100 | #222 | Tragic 11.3% |
| Uruguayans | 7.7 /100 | #223 | Tragic 11.3% |
| Immigrants | Hong Kong | 7.2 /100 | #224 | Tragic 11.3% |
| Immigrants | Sierra Leone | 6.4 /100 | #225 | Tragic 11.3% |
| Immigrants | Somalia | 5.4 /100 | #226 | Tragic 11.4% |
| Immigrants | Pakistan | 5.4 /100 | #227 | Tragic 11.4% |
| Immigrants | Romania | 5.3 /100 | #228 | Tragic 11.4% |
| Ugandans | 5.3 /100 | #229 | Tragic 11.4% |
| Immigrants | Norway | 5.1 /100 | #230 | Tragic 11.4% |
| Immigrants | Japan | 5.1 /100 | #231 | Tragic 11.4% |
| Immigrants | Turkey | 4.8 /100 | #232 | Tragic 11.5% |
| Houma | 4.7 /100 | #233 | Tragic 11.5% |
| Immigrants | Peru | 4.5 /100 | #234 | Tragic 11.5% |
| Kiowa | 4.0 /100 | #235 | Tragic 11.5% |
| Cree | 3.5 /100 | #236 | Tragic 11.6% |
| Ute | 3.3 /100 | #237 | Tragic 11.6% |
| Russians | 3.2 /100 | #238 | Tragic 11.6% |
| Taiwanese | 2.8 /100 | #239 | Tragic 11.7% |
| Immigrants | Immigrants | 2.7 /100 | #240 | Tragic 11.7% |
| Eastern Europeans | 2.7 /100 | #241 | Tragic 11.7% |