Belgian vs Finnish No Vehicles in Household
COMPARE
Belgian
Finnish
No Vehicles in Household
No Vehicles in Household Comparison
Belgians
Finns
8.0%
NO VEHICLES IN HOUSEHOLD
99.9/ 100
METRIC RATING
50th/ 347
METRIC RANK
7.7%
NO VEHICLES IN HOUSEHOLD
100.0/ 100
METRIC RATING
30th/ 347
METRIC RANK
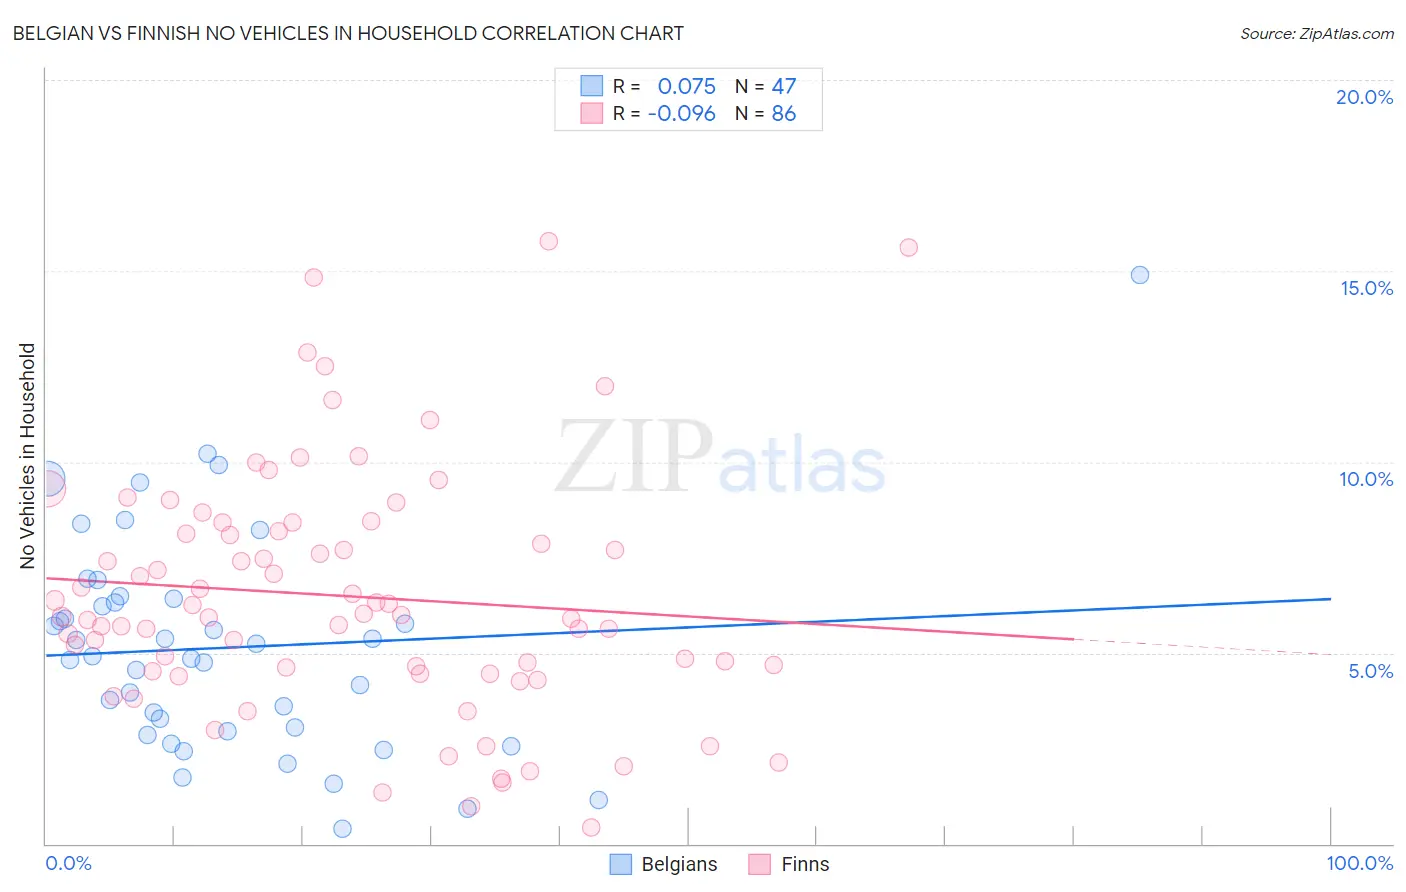
Belgian vs Finnish No Vehicles in Household Correlation Chart
The statistical analysis conducted on geographies consisting of 355,082,936 people shows a slight positive correlation between the proportion of Belgians and percentage of households with no vehicle available in the United States with a correlation coefficient (R) of 0.075 and weighted average of 8.0%. Similarly, the statistical analysis conducted on geographies consisting of 403,316,367 people shows a slight negative correlation between the proportion of Finns and percentage of households with no vehicle available in the United States with a correlation coefficient (R) of -0.096 and weighted average of 7.7%, a difference of 4.0%.
No Vehicles in Household Correlation Summary
| Measurement | Belgian | Finnish |
| Minimum | 0.40% | 0.44% |
| Maximum | 14.9% | 15.8% |
| Range | 14.5% | 15.3% |
| Mean | 5.1% | 6.5% |
| Median | 4.9% | 6.0% |
| Interquartile 25% (IQ1) | 2.9% | 4.5% |
| Interquartile 75% (IQ3) | 6.4% | 8.2% |
| Interquartile Range (IQR) | 3.5% | 3.7% |
| Standard Deviation (Sample) | 2.8% | 3.2% |
| Standard Deviation (Population) | 2.8% | 3.2% |
Demographics Similar to Belgians and Finns by No Vehicles in Household
In terms of no vehicles in household, the demographic groups most similar to Belgians are Guamanian/Chamorro (8.0%, a difference of 0.070%), Afghan (8.0%, a difference of 0.25%), Northern European (7.9%, a difference of 0.72%), Spanish (7.9%, a difference of 0.84%), and Nonimmigrants (7.9%, a difference of 1.1%). Similarly, the demographic groups most similar to Finns are Native Hawaiian (7.7%, a difference of 0.15%), Malaysian (7.7%, a difference of 0.40%), Immigrants from Taiwan (7.7%, a difference of 0.51%), Immigrants from Vietnam (7.7%, a difference of 0.64%), and Cherokee (7.7%, a difference of 0.78%).
| Demographics | Rating | Rank | No Vehicles in Household |
| Finns | 100.0 /100 | #30 | Exceptional 7.7% |
| Native Hawaiians | 100.0 /100 | #31 | Exceptional 7.7% |
| Malaysians | 100.0 /100 | #32 | Exceptional 7.7% |
| Immigrants | Taiwan | 100.0 /100 | #33 | Exceptional 7.7% |
| Immigrants | Vietnam | 100.0 /100 | #34 | Exceptional 7.7% |
| Cherokee | 99.9 /100 | #35 | Exceptional 7.7% |
| Iraqis | 99.9 /100 | #36 | Exceptional 7.7% |
| Basques | 99.9 /100 | #37 | Exceptional 7.8% |
| Creek | 99.9 /100 | #38 | Exceptional 7.8% |
| Immigrants | Fiji | 99.9 /100 | #39 | Exceptional 7.8% |
| Czechoslovakians | 99.9 /100 | #40 | Exceptional 7.8% |
| French Canadians | 99.9 /100 | #41 | Exceptional 7.8% |
| Swiss | 99.9 /100 | #42 | Exceptional 7.9% |
| Chickasaw | 99.9 /100 | #43 | Exceptional 7.9% |
| Choctaw | 99.9 /100 | #44 | Exceptional 7.9% |
| Immigrants | Nonimmigrants | 99.9 /100 | #45 | Exceptional 7.9% |
| Spanish | 99.9 /100 | #46 | Exceptional 7.9% |
| Northern Europeans | 99.9 /100 | #47 | Exceptional 7.9% |
| Afghans | 99.9 /100 | #48 | Exceptional 8.0% |
| Guamanians/Chamorros | 99.9 /100 | #49 | Exceptional 8.0% |
| Belgians | 99.9 /100 | #50 | Exceptional 8.0% |