Armenian vs Immigrants from Pakistan No Vehicles in Household
COMPARE
Armenian
Immigrants from Pakistan
No Vehicles in Household
No Vehicles in Household Comparison
Armenians
Immigrants from Pakistan
9.4%
NO VEHICLES IN HOUSEHOLD
95.0/ 100
METRIC RATING
112th/ 347
METRIC RANK
11.4%
NO VEHICLES IN HOUSEHOLD
5.4/ 100
METRIC RATING
227th/ 347
METRIC RANK
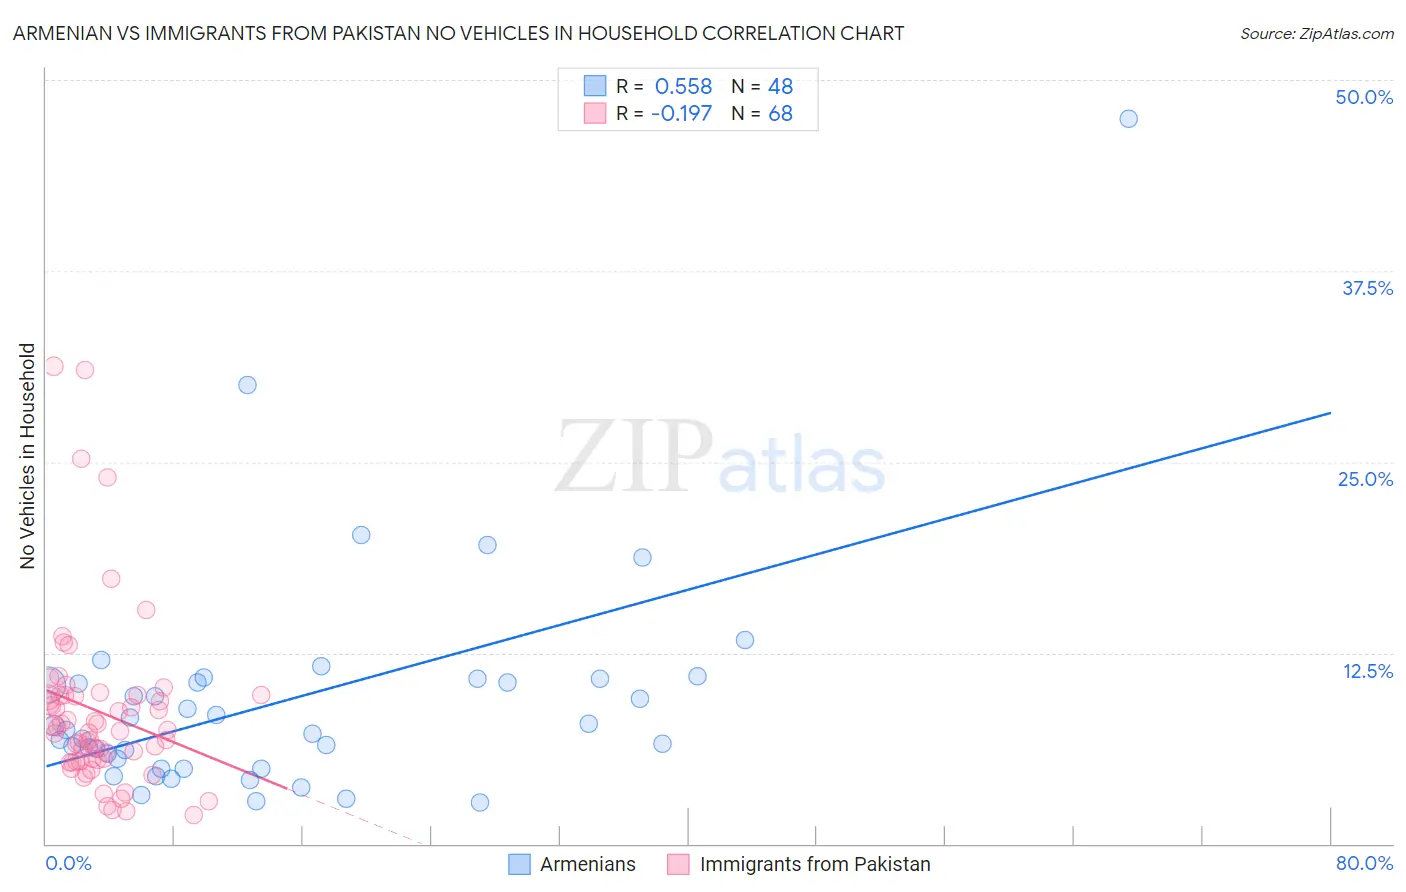
Armenian vs Immigrants from Pakistan No Vehicles in Household Correlation Chart
The statistical analysis conducted on geographies consisting of 310,342,766 people shows a substantial positive correlation between the proportion of Armenians and percentage of households with no vehicle available in the United States with a correlation coefficient (R) of 0.558 and weighted average of 9.4%. Similarly, the statistical analysis conducted on geographies consisting of 283,461,123 people shows a poor negative correlation between the proportion of Immigrants from Pakistan and percentage of households with no vehicle available in the United States with a correlation coefficient (R) of -0.197 and weighted average of 11.4%, a difference of 21.8%.
No Vehicles in Household Correlation Summary
| Measurement | Armenian | Immigrants from Pakistan |
| Minimum | 2.7% | 1.9% |
| Maximum | 47.4% | 31.2% |
| Range | 44.7% | 29.4% |
| Mean | 9.4% | 8.6% |
| Median | 7.6% | 7.4% |
| Interquartile 25% (IQ1) | 5.2% | 5.5% |
| Interquartile 75% (IQ3) | 10.7% | 9.7% |
| Interquartile Range (IQR) | 5.4% | 4.3% |
| Standard Deviation (Sample) | 7.6% | 5.8% |
| Standard Deviation (Population) | 7.5% | 5.7% |
Similar Demographics by No Vehicles in Household
Demographics Similar to Armenians by No Vehicles in Household
In terms of no vehicles in household, the demographic groups most similar to Armenians are Immigrants from Kuwait (9.4%, a difference of 0.090%), Immigrants from Netherlands (9.4%, a difference of 0.10%), Serbian (9.4%, a difference of 0.52%), Navajo (9.4%, a difference of 0.59%), and Japanese (9.4%, a difference of 0.66%).
| Demographics | Rating | Rank | No Vehicles in Household |
| Spanish Americans | 97.9 /100 | #105 | Exceptional 9.1% |
| Laotians | 97.8 /100 | #106 | Exceptional 9.1% |
| Hispanics or Latinos | 97.7 /100 | #107 | Exceptional 9.1% |
| Mexican American Indians | 97.6 /100 | #108 | Exceptional 9.1% |
| Maltese | 97.6 /100 | #109 | Exceptional 9.1% |
| Delaware | 97.2 /100 | #110 | Exceptional 9.2% |
| Immigrants | Kuwait | 95.1 /100 | #111 | Exceptional 9.4% |
| Armenians | 95.0 /100 | #112 | Exceptional 9.4% |
| Immigrants | Netherlands | 94.8 /100 | #113 | Exceptional 9.4% |
| Serbians | 94.3 /100 | #114 | Exceptional 9.4% |
| Navajo | 94.2 /100 | #115 | Exceptional 9.4% |
| Japanese | 94.1 /100 | #116 | Exceptional 9.4% |
| Chippewa | 93.8 /100 | #117 | Exceptional 9.4% |
| Greeks | 92.9 /100 | #118 | Exceptional 9.5% |
| Fijians | 92.7 /100 | #119 | Exceptional 9.5% |
Demographics Similar to Immigrants from Pakistan by No Vehicles in Household
In terms of no vehicles in household, the demographic groups most similar to Immigrants from Pakistan are Immigrants from Somalia (11.4%, a difference of 0.020%), Immigrants from Romania (11.4%, a difference of 0.040%), Ugandan (11.4%, a difference of 0.080%), Immigrants from Norway (11.4%, a difference of 0.21%), and Immigrants from Japan (11.4%, a difference of 0.21%).
| Demographics | Rating | Rank | No Vehicles in Household |
| Immigrants | Zaire | 9.6 /100 | #220 | Tragic 11.2% |
| Peruvians | 8.4 /100 | #221 | Tragic 11.2% |
| Immigrants | South America | 8.0 /100 | #222 | Tragic 11.3% |
| Uruguayans | 7.7 /100 | #223 | Tragic 11.3% |
| Immigrants | Hong Kong | 7.2 /100 | #224 | Tragic 11.3% |
| Immigrants | Sierra Leone | 6.4 /100 | #225 | Tragic 11.3% |
| Immigrants | Somalia | 5.4 /100 | #226 | Tragic 11.4% |
| Immigrants | Pakistan | 5.4 /100 | #227 | Tragic 11.4% |
| Immigrants | Romania | 5.3 /100 | #228 | Tragic 11.4% |
| Ugandans | 5.3 /100 | #229 | Tragic 11.4% |
| Immigrants | Norway | 5.1 /100 | #230 | Tragic 11.4% |
| Immigrants | Japan | 5.1 /100 | #231 | Tragic 11.4% |
| Immigrants | Turkey | 4.8 /100 | #232 | Tragic 11.5% |
| Houma | 4.7 /100 | #233 | Tragic 11.5% |
| Immigrants | Peru | 4.5 /100 | #234 | Tragic 11.5% |