Yup'ik vs Lumbee Unemployment Among Ages 65 to 74 years
COMPARE
Yup'ik
Lumbee
Unemployment Among Ages 65 to 74 years
Unemployment Among Ages 65 to 74 years Comparison
Yup'ik
Lumbee
9.5%
UNEMPLOYMENT AMONG AGES 65 TO 74 YEARS
0.0/ 100
METRIC RATING
346th/ 347
METRIC RANK
4.8%
UNEMPLOYMENT AMONG AGES 65 TO 74 YEARS
100.0/ 100
METRIC RATING
13th/ 347
METRIC RANK
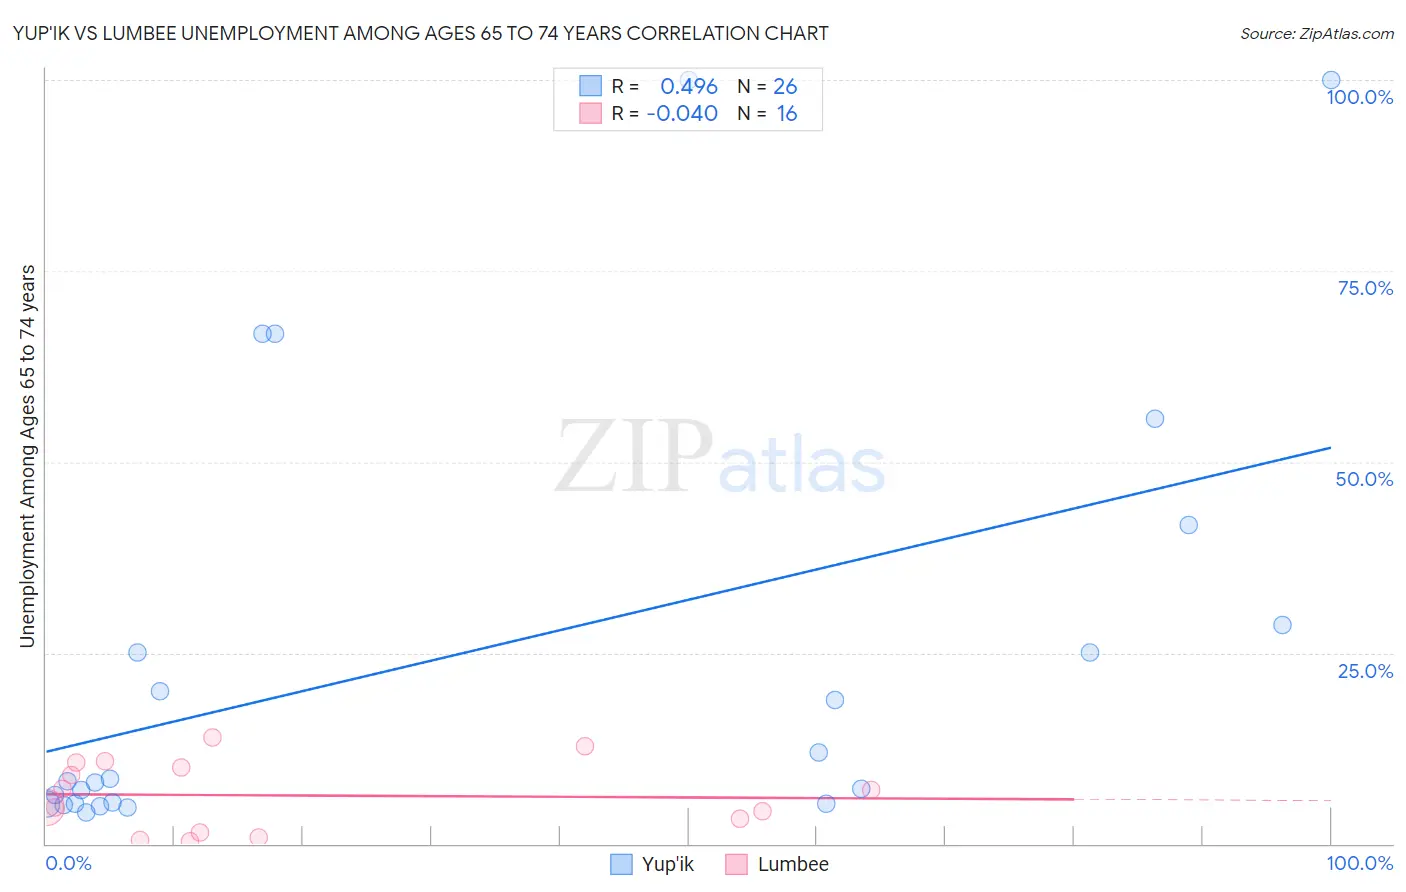
Yup'ik vs Lumbee Unemployment Among Ages 65 to 74 years Correlation Chart
The statistical analysis conducted on geographies consisting of 38,042,945 people shows a moderate positive correlation between the proportion of Yup'ik and unemployment rate among population between the ages 65 and 74 in the United States with a correlation coefficient (R) of 0.496 and weighted average of 9.5%. Similarly, the statistical analysis conducted on geographies consisting of 85,752,030 people shows no correlation between the proportion of Lumbee and unemployment rate among population between the ages 65 and 74 in the United States with a correlation coefficient (R) of -0.040 and weighted average of 4.8%, a difference of 99.0%.
Unemployment Among Ages 65 to 74 years Correlation Summary
| Measurement | Yup'ik | Lumbee |
| Minimum | 4.1% | 0.30% |
| Maximum | 100.0% | 13.9% |
| Range | 95.9% | 13.6% |
| Mean | 24.8% | 6.3% |
| Median | 8.4% | 5.9% |
| Interquartile 25% (IQ1) | 5.3% | 2.4% |
| Interquartile 75% (IQ3) | 28.6% | 10.3% |
| Interquartile Range (IQR) | 23.3% | 7.9% |
| Standard Deviation (Sample) | 29.1% | 4.5% |
| Standard Deviation (Population) | 28.6% | 4.3% |
Similar Demographics by Unemployment Among Ages 65 to 74 years
Demographics Similar to Yup'ik by Unemployment Among Ages 65 to 74 years
In terms of unemployment among ages 65 to 74 years, the demographic groups most similar to Yup'ik are Immigrants from Yemen (8.3%, a difference of 14.6%), Inupiat (7.5%, a difference of 26.3%), Alaskan Athabascan (7.4%, a difference of 28.7%), Navajo (6.9%, a difference of 36.6%), and Alaska Native (6.8%, a difference of 38.6%).
| Demographics | Rating | Rank | Unemployment Among Ages 65 to 74 years |
| Paiute | 0.0 /100 | #333 | Tragic 6.3% |
| Taiwanese | 0.0 /100 | #334 | Tragic 6.3% |
| Puerto Ricans | 0.0 /100 | #335 | Tragic 6.4% |
| Immigrants | Armenia | 0.0 /100 | #336 | Tragic 6.5% |
| Ute | 0.0 /100 | #337 | Tragic 6.5% |
| Tlingit-Haida | 0.0 /100 | #338 | Tragic 6.5% |
| Yakama | 0.0 /100 | #339 | Tragic 6.6% |
| Pima | 0.0 /100 | #340 | Tragic 6.6% |
| Alaska Natives | 0.0 /100 | #341 | Tragic 6.8% |
| Navajo | 0.0 /100 | #342 | Tragic 6.9% |
| Alaskan Athabascans | 0.0 /100 | #343 | Tragic 7.4% |
| Inupiat | 0.0 /100 | #344 | Tragic 7.5% |
| Immigrants | Yemen | 0.0 /100 | #345 | Tragic 8.3% |
| Yup'ik | 0.0 /100 | #346 | Tragic 9.5% |
| Crow | 0.0 /100 | #347 | Tragic 17.4% |
Demographics Similar to Lumbee by Unemployment Among Ages 65 to 74 years
In terms of unemployment among ages 65 to 74 years, the demographic groups most similar to Lumbee are Tongan (4.7%, a difference of 0.18%), Cuban (4.8%, a difference of 0.28%), Immigrants from Congo (4.7%, a difference of 0.34%), Osage (4.7%, a difference of 0.75%), and Chickasaw (4.7%, a difference of 0.87%).
| Demographics | Rating | Rank | Unemployment Among Ages 65 to 74 years |
| Immigrants | Cuba | 100.0 /100 | #6 | Exceptional 4.6% |
| Indonesians | 100.0 /100 | #7 | Exceptional 4.7% |
| Comanche | 100.0 /100 | #8 | Exceptional 4.7% |
| Chickasaw | 100.0 /100 | #9 | Exceptional 4.7% |
| Osage | 100.0 /100 | #10 | Exceptional 4.7% |
| Immigrants | Congo | 100.0 /100 | #11 | Exceptional 4.7% |
| Tongans | 100.0 /100 | #12 | Exceptional 4.7% |
| Lumbee | 100.0 /100 | #13 | Exceptional 4.8% |
| Cubans | 100.0 /100 | #14 | Exceptional 4.8% |
| Immigrants | North Macedonia | 100.0 /100 | #15 | Exceptional 4.8% |
| Immigrants | Burma/Myanmar | 100.0 /100 | #16 | Exceptional 4.8% |
| Kenyans | 100.0 /100 | #17 | Exceptional 4.8% |
| Creek | 100.0 /100 | #18 | Exceptional 4.8% |
| Menominee | 100.0 /100 | #19 | Exceptional 4.8% |
| Immigrants | Zaire | 100.0 /100 | #20 | Exceptional 4.8% |