Yuman vs Immigrants from Fiji Unemployment Among Ages 16 to 19 years
COMPARE
Yuman
Immigrants from Fiji
Unemployment Among Ages 16 to 19 years
Unemployment Among Ages 16 to 19 years Comparison
Yuman
Immigrants from Fiji
37.4%
UNEMPLOYMENT AMONG AGES 16 TO 19 YEARS
0.0/ 100
METRIC RATING
346th/ 347
METRIC RANK
17.8%
UNEMPLOYMENT AMONG AGES 16 TO 19 YEARS
27.7/ 100
METRIC RATING
200th/ 347
METRIC RANK
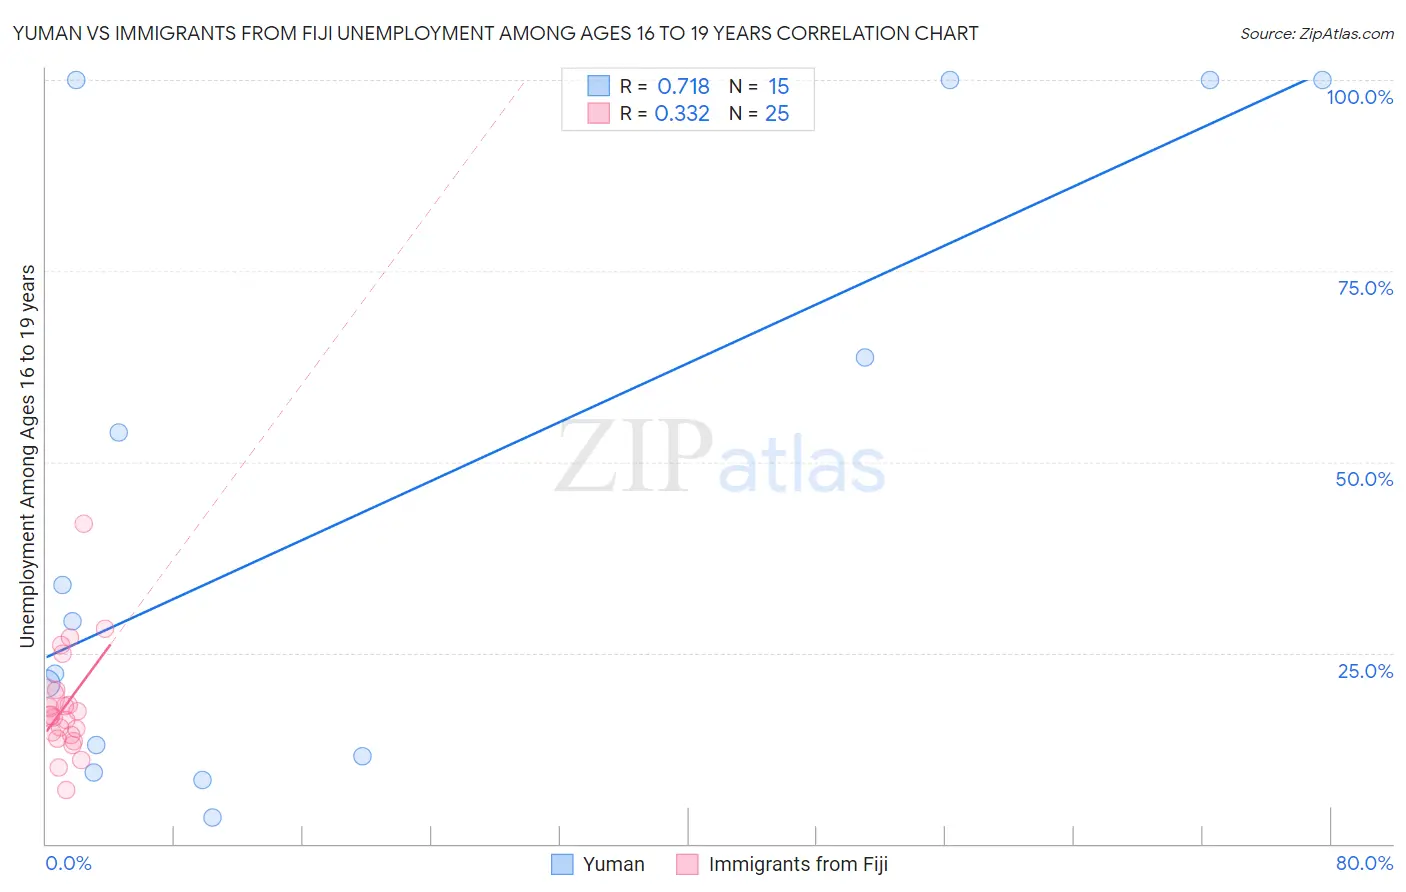
Yuman vs Immigrants from Fiji Unemployment Among Ages 16 to 19 years Correlation Chart
The statistical analysis conducted on geographies consisting of 40,333,032 people shows a strong positive correlation between the proportion of Yuman and unemployment rate among population between the ages 16 and 19 in the United States with a correlation coefficient (R) of 0.718 and weighted average of 37.4%. Similarly, the statistical analysis conducted on geographies consisting of 92,620,929 people shows a mild positive correlation between the proportion of Immigrants from Fiji and unemployment rate among population between the ages 16 and 19 in the United States with a correlation coefficient (R) of 0.332 and weighted average of 17.8%, a difference of 110.6%.
Unemployment Among Ages 16 to 19 years Correlation Summary
| Measurement | Yuman | Immigrants from Fiji |
| Minimum | 3.5% | 7.0% |
| Maximum | 100.0% | 41.9% |
| Range | 96.5% | 34.9% |
| Mean | 44.6% | 18.1% |
| Median | 29.1% | 16.7% |
| Interquartile 25% (IQ1) | 11.5% | 14.0% |
| Interquartile 75% (IQ3) | 100.0% | 19.6% |
| Interquartile Range (IQR) | 88.5% | 5.6% |
| Standard Deviation (Sample) | 38.2% | 7.1% |
| Standard Deviation (Population) | 36.9% | 7.0% |
Similar Demographics by Unemployment Among Ages 16 to 19 years
Demographics Similar to Yuman by Unemployment Among Ages 16 to 19 years
In terms of unemployment among ages 16 to 19 years, the demographic groups most similar to Yuman are Yup'ik (41.0%, a difference of 9.5%), Hopi (30.7%, a difference of 22.1%), Colville (29.7%, a difference of 26.2%), Navajo (29.0%, a difference of 28.9%), and Inupiat (28.1%, a difference of 33.4%).
| Demographics | Rating | Rank | Unemployment Among Ages 16 to 19 years |
| Paiute | 0.0 /100 | #333 | Tragic 24.4% |
| Guyanese | 0.0 /100 | #334 | Tragic 24.8% |
| Arapaho | 0.0 /100 | #335 | Tragic 25.2% |
| Kiowa | 0.0 /100 | #336 | Tragic 25.2% |
| Immigrants | Guyana | 0.0 /100 | #337 | Tragic 25.5% |
| Immigrants | St. Vincent and the Grenadines | 0.0 /100 | #338 | Tragic 25.7% |
| Immigrants | Grenada | 0.0 /100 | #339 | Tragic 25.7% |
| Crow | 0.0 /100 | #340 | Tragic 26.2% |
| Puerto Ricans | 0.0 /100 | #341 | Tragic 27.5% |
| Inupiat | 0.0 /100 | #342 | Tragic 28.1% |
| Navajo | 0.0 /100 | #343 | Tragic 29.0% |
| Colville | 0.0 /100 | #344 | Tragic 29.7% |
| Hopi | 0.0 /100 | #345 | Tragic 30.7% |
| Yuman | 0.0 /100 | #346 | Tragic 37.4% |
| Yup'ik | 0.0 /100 | #347 | Tragic 41.0% |
Demographics Similar to Immigrants from Fiji by Unemployment Among Ages 16 to 19 years
In terms of unemployment among ages 16 to 19 years, the demographic groups most similar to Immigrants from Fiji are Immigrants from Ethiopia (17.8%, a difference of 0.020%), Immigrants from Portugal (17.8%, a difference of 0.030%), Immigrants from Ireland (17.8%, a difference of 0.050%), Ethiopian (17.8%, a difference of 0.11%), and Immigrants from Czechoslovakia (17.8%, a difference of 0.12%).
| Demographics | Rating | Rank | Unemployment Among Ages 16 to 19 years |
| Immigrants | Australia | 40.6 /100 | #193 | Average 17.7% |
| Peruvians | 38.8 /100 | #194 | Fair 17.7% |
| Immigrants | Peru | 37.3 /100 | #195 | Fair 17.7% |
| Alaskan Athabascans | 34.1 /100 | #196 | Fair 17.7% |
| Immigrants | Czechoslovakia | 29.8 /100 | #197 | Fair 17.8% |
| Ethiopians | 29.6 /100 | #198 | Fair 17.8% |
| Immigrants | Ireland | 28.5 /100 | #199 | Fair 17.8% |
| Immigrants | Fiji | 27.7 /100 | #200 | Fair 17.8% |
| Immigrants | Ethiopia | 27.4 /100 | #201 | Fair 17.8% |
| Immigrants | Portugal | 27.2 /100 | #202 | Fair 17.8% |
| Immigrants | Eastern Europe | 23.6 /100 | #203 | Fair 17.8% |
| Immigrants | Nonimmigrants | 20.9 /100 | #204 | Fair 17.9% |
| Assyrians/Chaldeans/Syriacs | 20.8 /100 | #205 | Fair 17.9% |
| Immigrants | Southern Europe | 18.9 /100 | #206 | Poor 17.9% |
| Liberians | 18.6 /100 | #207 | Poor 17.9% |