Lithuanian vs Immigrants from Fiji Unemployment Among Ages 16 to 19 years
COMPARE
Lithuanian
Immigrants from Fiji
Unemployment Among Ages 16 to 19 years
Unemployment Among Ages 16 to 19 years Comparison
Lithuanians
Immigrants from Fiji
16.7%
UNEMPLOYMENT AMONG AGES 16 TO 19 YEARS
98.2/ 100
METRIC RATING
73rd/ 347
METRIC RANK
17.8%
UNEMPLOYMENT AMONG AGES 16 TO 19 YEARS
27.7/ 100
METRIC RATING
200th/ 347
METRIC RANK
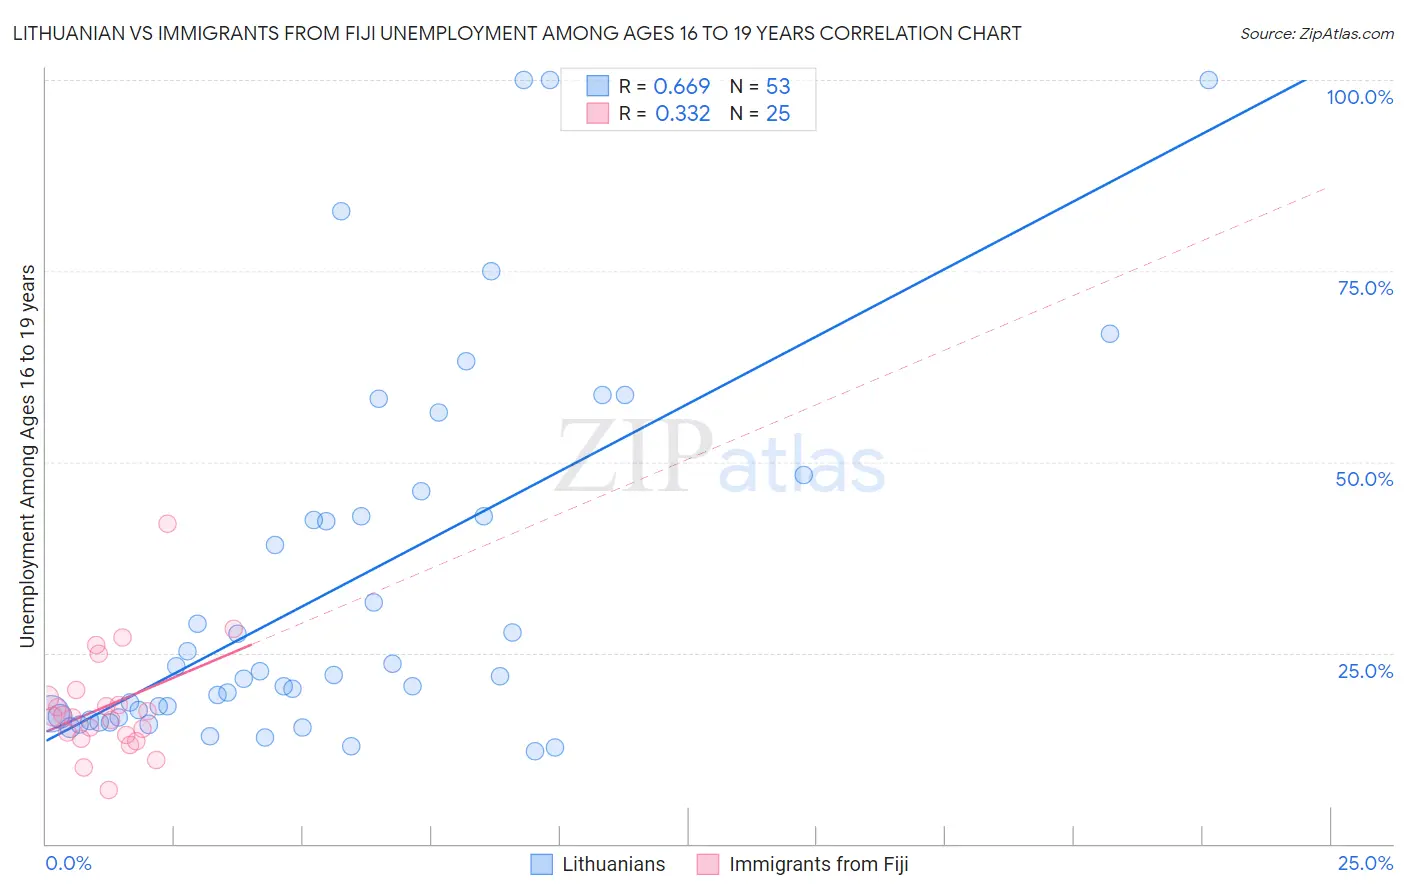
Lithuanian vs Immigrants from Fiji Unemployment Among Ages 16 to 19 years Correlation Chart
The statistical analysis conducted on geographies consisting of 394,472,378 people shows a significant positive correlation between the proportion of Lithuanians and unemployment rate among population between the ages 16 and 19 in the United States with a correlation coefficient (R) of 0.669 and weighted average of 16.7%. Similarly, the statistical analysis conducted on geographies consisting of 92,620,929 people shows a mild positive correlation between the proportion of Immigrants from Fiji and unemployment rate among population between the ages 16 and 19 in the United States with a correlation coefficient (R) of 0.332 and weighted average of 17.8%, a difference of 6.1%.
Unemployment Among Ages 16 to 19 years Correlation Summary
| Measurement | Lithuanian | Immigrants from Fiji |
| Minimum | 12.2% | 7.0% |
| Maximum | 100.0% | 41.9% |
| Range | 87.8% | 34.9% |
| Mean | 33.9% | 18.1% |
| Median | 22.1% | 16.7% |
| Interquartile 25% (IQ1) | 16.6% | 14.0% |
| Interquartile 75% (IQ3) | 44.5% | 19.6% |
| Interquartile Range (IQR) | 27.9% | 5.6% |
| Standard Deviation (Sample) | 24.2% | 7.1% |
| Standard Deviation (Population) | 24.0% | 7.0% |
Similar Demographics by Unemployment Among Ages 16 to 19 years
Demographics Similar to Lithuanians by Unemployment Among Ages 16 to 19 years
In terms of unemployment among ages 16 to 19 years, the demographic groups most similar to Lithuanians are Immigrants from Eastern Africa (16.8%, a difference of 0.030%), New Zealander (16.8%, a difference of 0.090%), Immigrants from North America (16.8%, a difference of 0.16%), Immigrants from Singapore (16.8%, a difference of 0.22%), and Immigrants from Canada (16.7%, a difference of 0.24%).
| Demographics | Rating | Rank | Unemployment Among Ages 16 to 19 years |
| Okinawans | 98.9 /100 | #66 | Exceptional 16.6% |
| Slavs | 98.7 /100 | #67 | Exceptional 16.7% |
| Chickasaw | 98.7 /100 | #68 | Exceptional 16.7% |
| Serbians | 98.7 /100 | #69 | Exceptional 16.7% |
| Austrians | 98.6 /100 | #70 | Exceptional 16.7% |
| Latvians | 98.5 /100 | #71 | Exceptional 16.7% |
| Immigrants | Canada | 98.5 /100 | #72 | Exceptional 16.7% |
| Lithuanians | 98.2 /100 | #73 | Exceptional 16.7% |
| Immigrants | Eastern Africa | 98.1 /100 | #74 | Exceptional 16.8% |
| New Zealanders | 98.0 /100 | #75 | Exceptional 16.8% |
| Immigrants | North America | 97.9 /100 | #76 | Exceptional 16.8% |
| Immigrants | Singapore | 97.8 /100 | #77 | Exceptional 16.8% |
| Soviet Union | 97.8 /100 | #78 | Exceptional 16.8% |
| Slovaks | 97.5 /100 | #79 | Exceptional 16.8% |
| French Canadians | 97.5 /100 | #80 | Exceptional 16.8% |
Demographics Similar to Immigrants from Fiji by Unemployment Among Ages 16 to 19 years
In terms of unemployment among ages 16 to 19 years, the demographic groups most similar to Immigrants from Fiji are Immigrants from Ethiopia (17.8%, a difference of 0.020%), Immigrants from Portugal (17.8%, a difference of 0.030%), Immigrants from Ireland (17.8%, a difference of 0.050%), Ethiopian (17.8%, a difference of 0.11%), and Immigrants from Czechoslovakia (17.8%, a difference of 0.12%).
| Demographics | Rating | Rank | Unemployment Among Ages 16 to 19 years |
| Immigrants | Australia | 40.6 /100 | #193 | Average 17.7% |
| Peruvians | 38.8 /100 | #194 | Fair 17.7% |
| Immigrants | Peru | 37.3 /100 | #195 | Fair 17.7% |
| Alaskan Athabascans | 34.1 /100 | #196 | Fair 17.7% |
| Immigrants | Czechoslovakia | 29.8 /100 | #197 | Fair 17.8% |
| Ethiopians | 29.6 /100 | #198 | Fair 17.8% |
| Immigrants | Ireland | 28.5 /100 | #199 | Fair 17.8% |
| Immigrants | Fiji | 27.7 /100 | #200 | Fair 17.8% |
| Immigrants | Ethiopia | 27.4 /100 | #201 | Fair 17.8% |
| Immigrants | Portugal | 27.2 /100 | #202 | Fair 17.8% |
| Immigrants | Eastern Europe | 23.6 /100 | #203 | Fair 17.8% |
| Immigrants | Nonimmigrants | 20.9 /100 | #204 | Fair 17.9% |
| Assyrians/Chaldeans/Syriacs | 20.8 /100 | #205 | Fair 17.9% |
| Immigrants | Southern Europe | 18.9 /100 | #206 | Poor 17.9% |
| Liberians | 18.6 /100 | #207 | Poor 17.9% |