Yugoslavian vs Navajo Unemployment Among Ages 35 to 44 years
COMPARE
Yugoslavian
Navajo
Unemployment Among Ages 35 to 44 years
Unemployment Among Ages 35 to 44 years Comparison
Yugoslavians
Navajo
4.5%
UNEMPLOYMENT AMONG AGES 35 TO 44 YEARS
93.6/ 100
METRIC RATING
95th/ 347
METRIC RANK
9.3%
UNEMPLOYMENT AMONG AGES 35 TO 44 YEARS
0.0/ 100
METRIC RATING
342nd/ 347
METRIC RANK
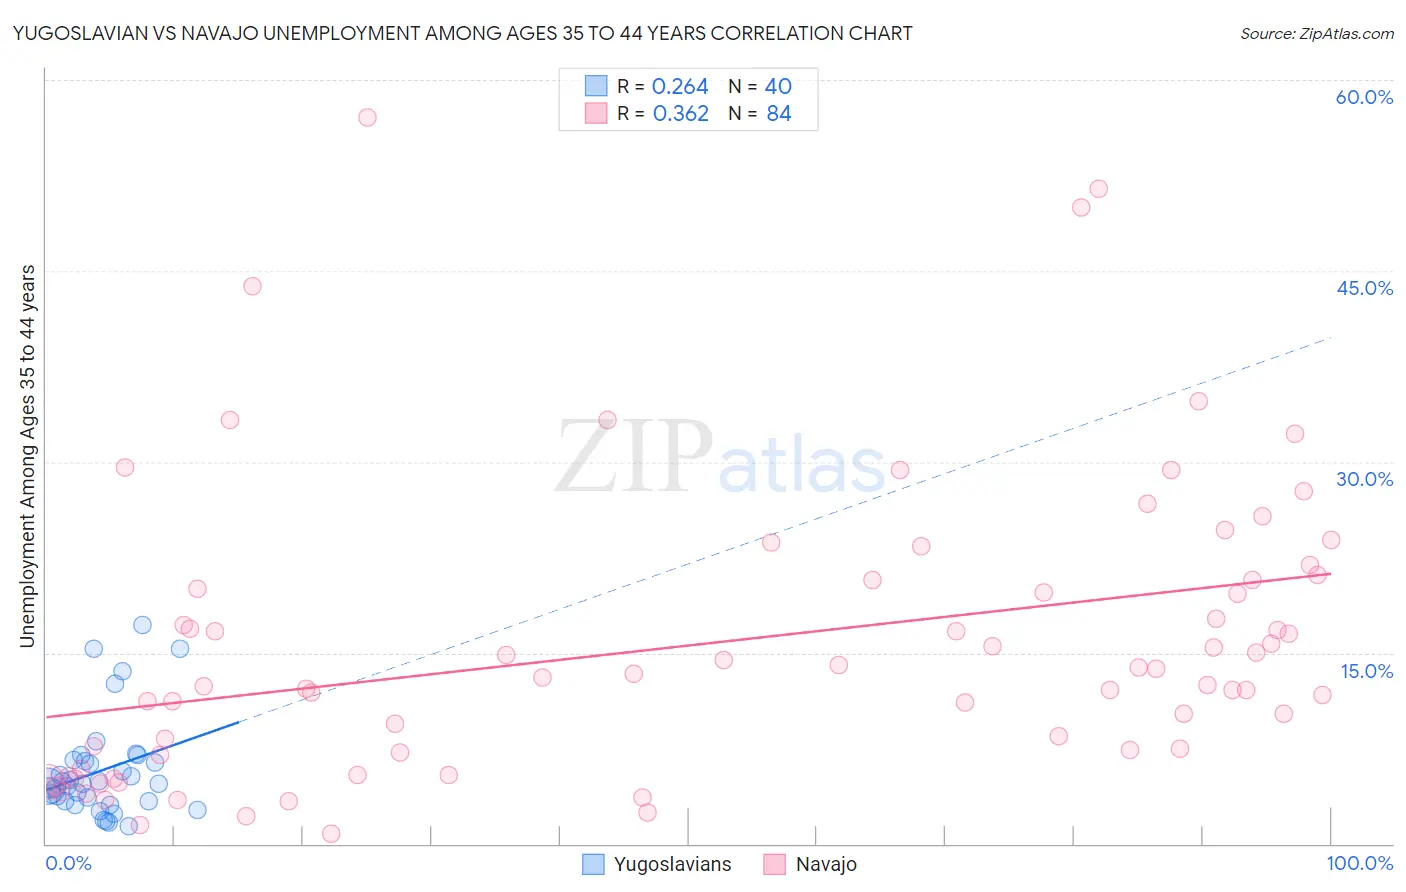
Yugoslavian vs Navajo Unemployment Among Ages 35 to 44 years Correlation Chart
The statistical analysis conducted on geographies consisting of 280,789,871 people shows a weak positive correlation between the proportion of Yugoslavians and unemployment rate among population between the ages 35 and 44 in the United States with a correlation coefficient (R) of 0.264 and weighted average of 4.5%. Similarly, the statistical analysis conducted on geographies consisting of 221,686,648 people shows a mild positive correlation between the proportion of Navajo and unemployment rate among population between the ages 35 and 44 in the United States with a correlation coefficient (R) of 0.362 and weighted average of 9.3%, a difference of 109.1%.
Unemployment Among Ages 35 to 44 years Correlation Summary
| Measurement | Yugoslavian | Navajo |
| Minimum | 1.4% | 0.80% |
| Maximum | 17.2% | 57.1% |
| Range | 15.8% | 56.3% |
| Mean | 5.7% | 15.7% |
| Median | 4.7% | 13.2% |
| Interquartile 25% (IQ1) | 3.3% | 7.1% |
| Interquartile 75% (IQ3) | 6.5% | 20.7% |
| Interquartile Range (IQR) | 3.2% | 13.6% |
| Standard Deviation (Sample) | 3.9% | 11.6% |
| Standard Deviation (Population) | 3.8% | 11.5% |
Similar Demographics by Unemployment Among Ages 35 to 44 years
Demographics Similar to Yugoslavians by Unemployment Among Ages 35 to 44 years
In terms of unemployment among ages 35 to 44 years, the demographic groups most similar to Yugoslavians are Russian (4.5%, a difference of 0.040%), Scottish (4.5%, a difference of 0.040%), Iranian (4.5%, a difference of 0.090%), Estonian (4.5%, a difference of 0.21%), and Immigrants from Northern Europe (4.5%, a difference of 0.22%).
| Demographics | Rating | Rank | Unemployment Among Ages 35 to 44 years |
| Immigrants | Latvia | 94.8 /100 | #88 | Exceptional 4.4% |
| Egyptians | 94.5 /100 | #89 | Exceptional 4.5% |
| Australians | 94.5 /100 | #90 | Exceptional 4.5% |
| Immigrants | Northern Europe | 94.3 /100 | #91 | Exceptional 4.5% |
| Estonians | 94.3 /100 | #92 | Exceptional 4.5% |
| Iranians | 93.9 /100 | #93 | Exceptional 4.5% |
| Russians | 93.8 /100 | #94 | Exceptional 4.5% |
| Yugoslavians | 93.6 /100 | #95 | Exceptional 4.5% |
| Scottish | 93.5 /100 | #96 | Exceptional 4.5% |
| Immigrants | France | 92.5 /100 | #97 | Exceptional 4.5% |
| Immigrants | Canada | 92.3 /100 | #98 | Exceptional 4.5% |
| Immigrants | Egypt | 92.3 /100 | #99 | Exceptional 4.5% |
| Italians | 91.9 /100 | #100 | Exceptional 4.5% |
| Immigrants | Netherlands | 91.9 /100 | #101 | Exceptional 4.5% |
| Immigrants | Sudan | 91.8 /100 | #102 | Exceptional 4.5% |
Demographics Similar to Navajo by Unemployment Among Ages 35 to 44 years
In terms of unemployment among ages 35 to 44 years, the demographic groups most similar to Navajo are Hopi (8.9%, a difference of 5.1%), Alaskan Athabascan (8.6%, a difference of 8.2%), Inupiat (8.6%, a difference of 8.9%), Cheyenne (8.5%, a difference of 10.1%), and Arapaho (10.3%, a difference of 10.2%).
| Demographics | Rating | Rank | Unemployment Among Ages 35 to 44 years |
| Puerto Ricans | 0.0 /100 | #333 | Tragic 7.6% |
| Houma | 0.0 /100 | #334 | Tragic 7.8% |
| Sioux | 0.0 /100 | #335 | Tragic 8.4% |
| Apache | 0.0 /100 | #336 | Tragic 8.4% |
| Tohono O'odham | 0.0 /100 | #337 | Tragic 8.4% |
| Cheyenne | 0.0 /100 | #338 | Tragic 8.5% |
| Inupiat | 0.0 /100 | #339 | Tragic 8.6% |
| Alaskan Athabascans | 0.0 /100 | #340 | Tragic 8.6% |
| Hopi | 0.0 /100 | #341 | Tragic 8.9% |
| Navajo | 0.0 /100 | #342 | Tragic 9.3% |
| Arapaho | 0.0 /100 | #343 | Tragic 10.3% |
| Pima | 0.0 /100 | #344 | Tragic 11.8% |
| Yup'ik | 0.0 /100 | #345 | Tragic 14.4% |
| Crow | 0.0 /100 | #346 | Tragic 15.7% |
| Yuman | 0.0 /100 | #347 | Tragic 16.9% |