Yugoslavian vs Immigrants from Austria Unemployment Among Youth under 25 years
COMPARE
Yugoslavian
Immigrants from Austria
Unemployment Among Youth under 25 years
Unemployment Among Youth under 25 years Comparison
Yugoslavians
Immigrants from Austria
10.7%
UNEMPLOYMENT AMONG YOUTH UNDER 25 YEARS
100.0/ 100
METRIC RATING
27th/ 347
METRIC RANK
11.3%
UNEMPLOYMENT AMONG YOUTH UNDER 25 YEARS
90.3/ 100
METRIC RATING
112th/ 347
METRIC RANK
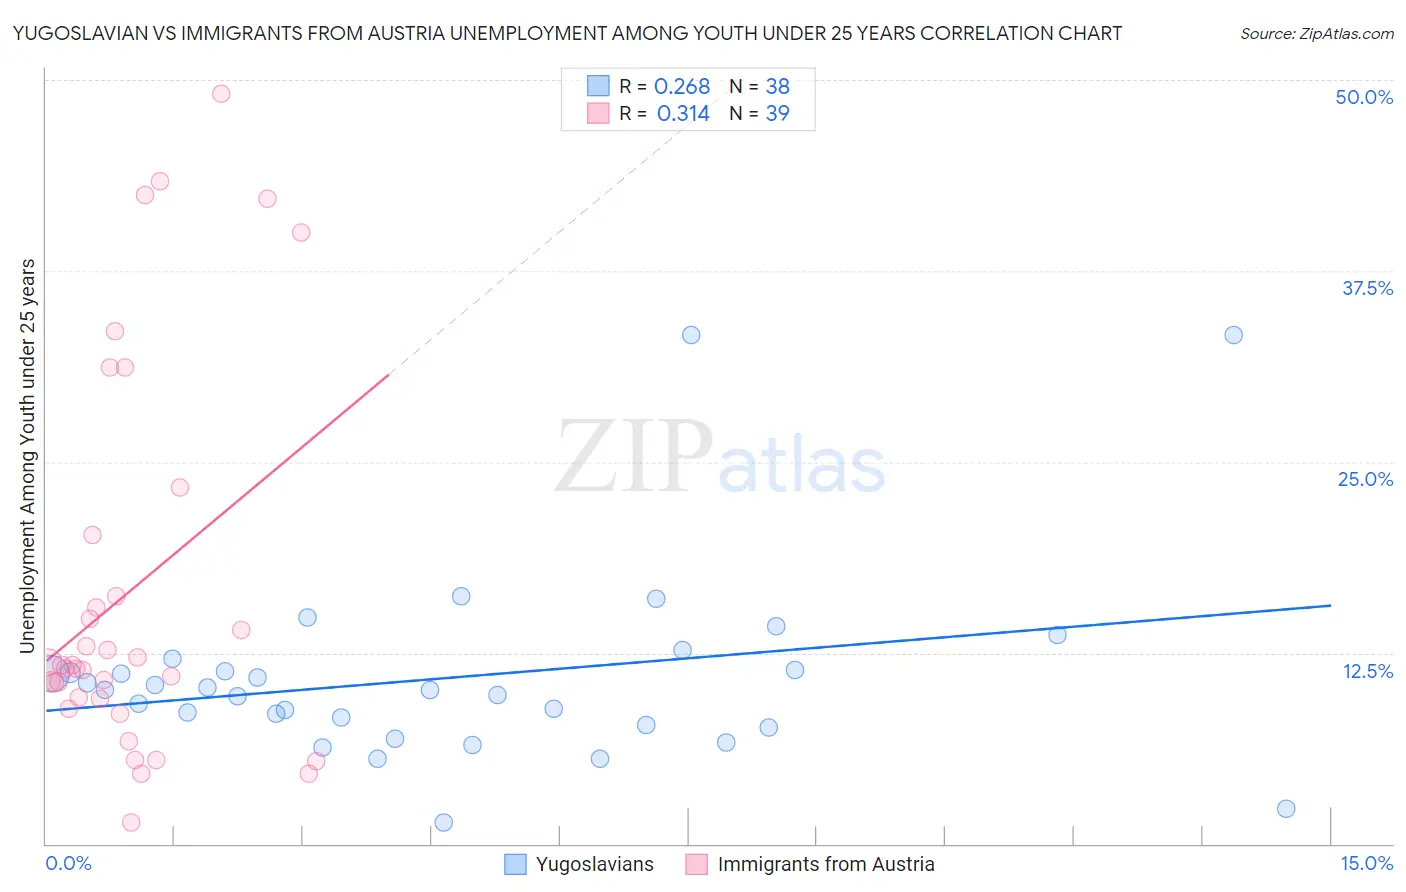
Yugoslavian vs Immigrants from Austria Unemployment Among Youth under 25 years Correlation Chart
The statistical analysis conducted on geographies consisting of 282,827,207 people shows a weak positive correlation between the proportion of Yugoslavians and unemployment rate among youth under the age of 25 in the United States with a correlation coefficient (R) of 0.268 and weighted average of 10.7%. Similarly, the statistical analysis conducted on geographies consisting of 166,729,608 people shows a mild positive correlation between the proportion of Immigrants from Austria and unemployment rate among youth under the age of 25 in the United States with a correlation coefficient (R) of 0.314 and weighted average of 11.3%, a difference of 6.3%.
Unemployment Among Youth under 25 years Correlation Summary
| Measurement | Yugoslavian | Immigrants from Austria |
| Minimum | 1.4% | 1.4% |
| Maximum | 33.3% | 49.1% |
| Range | 31.9% | 47.6% |
| Mean | 10.9% | 16.6% |
| Median | 10.1% | 11.7% |
| Interquartile 25% (IQ1) | 7.8% | 9.5% |
| Interquartile 75% (IQ3) | 11.4% | 20.2% |
| Interquartile Range (IQR) | 3.6% | 10.7% |
| Standard Deviation (Sample) | 6.3% | 12.6% |
| Standard Deviation (Population) | 6.2% | 12.4% |
Similar Demographics by Unemployment Among Youth under 25 years
Demographics Similar to Yugoslavians by Unemployment Among Youth under 25 years
In terms of unemployment among youth under 25 years, the demographic groups most similar to Yugoslavians are Immigrants from India (10.7%, a difference of 0.020%), Somali (10.7%, a difference of 0.040%), Finnish (10.7%, a difference of 0.11%), Immigrants from North Macedonia (10.7%, a difference of 0.11%), and Immigrants from Bosnia and Herzegovina (10.6%, a difference of 0.36%).
| Demographics | Rating | Rank | Unemployment Among Youth under 25 years |
| Dutch | 100.0 /100 | #20 | Exceptional 10.6% |
| Pennsylvania Germans | 100.0 /100 | #21 | Exceptional 10.6% |
| Belgians | 100.0 /100 | #22 | Exceptional 10.6% |
| Immigrants | Bosnia and Herzegovina | 100.0 /100 | #23 | Exceptional 10.6% |
| Finns | 100.0 /100 | #24 | Exceptional 10.7% |
| Immigrants | North Macedonia | 100.0 /100 | #25 | Exceptional 10.7% |
| Immigrants | India | 100.0 /100 | #26 | Exceptional 10.7% |
| Yugoslavians | 100.0 /100 | #27 | Exceptional 10.7% |
| Somalis | 100.0 /100 | #28 | Exceptional 10.7% |
| Chinese | 99.9 /100 | #29 | Exceptional 10.7% |
| Osage | 99.9 /100 | #30 | Exceptional 10.7% |
| Slovenes | 99.9 /100 | #31 | Exceptional 10.7% |
| Taiwanese | 99.9 /100 | #32 | Exceptional 10.8% |
| Europeans | 99.9 /100 | #33 | Exceptional 10.8% |
| English | 99.9 /100 | #34 | Exceptional 10.8% |
Demographics Similar to Immigrants from Austria by Unemployment Among Youth under 25 years
In terms of unemployment among youth under 25 years, the demographic groups most similar to Immigrants from Austria are Immigrants from France (11.3%, a difference of 0.0%), Fijian (11.3%, a difference of 0.010%), Immigrants from Ethiopia (11.3%, a difference of 0.040%), Immigrants from Vietnam (11.3%, a difference of 0.050%), and Burmese (11.3%, a difference of 0.060%).
| Demographics | Rating | Rank | Unemployment Among Youth under 25 years |
| Immigrants | Jordan | 93.1 /100 | #105 | Exceptional 11.3% |
| Chileans | 93.0 /100 | #106 | Exceptional 11.3% |
| Immigrants | Lithuania | 92.9 /100 | #107 | Exceptional 11.3% |
| Immigrants | Kuwait | 92.9 /100 | #108 | Exceptional 11.3% |
| Iranians | 92.0 /100 | #109 | Exceptional 11.3% |
| Immigrants | Norway | 91.5 /100 | #110 | Exceptional 11.3% |
| Immigrants | France | 90.3 /100 | #111 | Exceptional 11.3% |
| Immigrants | Austria | 90.3 /100 | #112 | Exceptional 11.3% |
| Fijians | 90.2 /100 | #113 | Exceptional 11.3% |
| Immigrants | Ethiopia | 89.9 /100 | #114 | Excellent 11.3% |
| Immigrants | Vietnam | 89.9 /100 | #115 | Excellent 11.3% |
| Burmese | 89.8 /100 | #116 | Excellent 11.3% |
| Sri Lankans | 89.8 /100 | #117 | Excellent 11.3% |
| Afghans | 89.7 /100 | #118 | Excellent 11.3% |
| Immigrants | Scotland | 89.2 /100 | #119 | Excellent 11.4% |