Yugoslavian vs Houma Unemployment Among Youth under 25 years
COMPARE
Yugoslavian
Houma
Unemployment Among Youth under 25 years
Unemployment Among Youth under 25 years Comparison
Yugoslavians
Houma
10.7%
UNEMPLOYMENT AMONG YOUTH UNDER 25 YEARS
100.0/ 100
METRIC RATING
27th/ 347
METRIC RANK
13.8%
UNEMPLOYMENT AMONG YOUTH UNDER 25 YEARS
0.0/ 100
METRIC RATING
304th/ 347
METRIC RANK
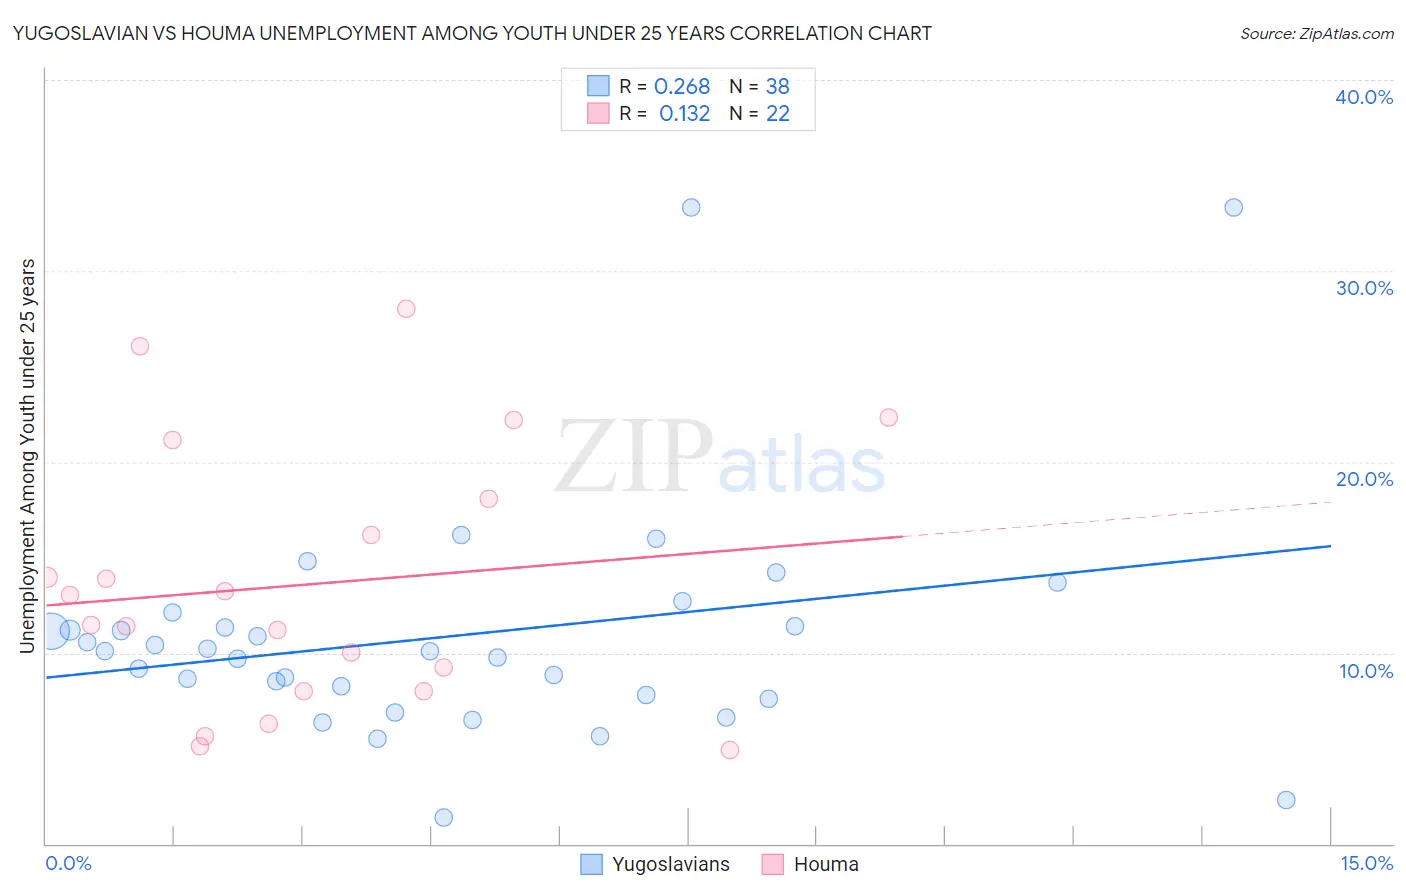
Yugoslavian vs Houma Unemployment Among Youth under 25 years Correlation Chart
The statistical analysis conducted on geographies consisting of 282,827,207 people shows a weak positive correlation between the proportion of Yugoslavians and unemployment rate among youth under the age of 25 in the United States with a correlation coefficient (R) of 0.268 and weighted average of 10.7%. Similarly, the statistical analysis conducted on geographies consisting of 36,647,392 people shows a poor positive correlation between the proportion of Houma and unemployment rate among youth under the age of 25 in the United States with a correlation coefficient (R) of 0.132 and weighted average of 13.8%, a difference of 29.6%.
Unemployment Among Youth under 25 years Correlation Summary
| Measurement | Yugoslavian | Houma |
| Minimum | 1.4% | 4.9% |
| Maximum | 33.3% | 28.0% |
| Range | 31.9% | 23.1% |
| Mean | 10.9% | 13.6% |
| Median | 10.1% | 12.2% |
| Interquartile 25% (IQ1) | 7.8% | 8.0% |
| Interquartile 75% (IQ3) | 11.4% | 18.0% |
| Interquartile Range (IQR) | 3.6% | 10.0% |
| Standard Deviation (Sample) | 6.3% | 6.8% |
| Standard Deviation (Population) | 6.2% | 6.6% |
Similar Demographics by Unemployment Among Youth under 25 years
Demographics Similar to Yugoslavians by Unemployment Among Youth under 25 years
In terms of unemployment among youth under 25 years, the demographic groups most similar to Yugoslavians are Immigrants from India (10.7%, a difference of 0.020%), Somali (10.7%, a difference of 0.040%), Finnish (10.7%, a difference of 0.11%), Immigrants from North Macedonia (10.7%, a difference of 0.11%), and Immigrants from Bosnia and Herzegovina (10.6%, a difference of 0.36%).
| Demographics | Rating | Rank | Unemployment Among Youth under 25 years |
| Dutch | 100.0 /100 | #20 | Exceptional 10.6% |
| Pennsylvania Germans | 100.0 /100 | #21 | Exceptional 10.6% |
| Belgians | 100.0 /100 | #22 | Exceptional 10.6% |
| Immigrants | Bosnia and Herzegovina | 100.0 /100 | #23 | Exceptional 10.6% |
| Finns | 100.0 /100 | #24 | Exceptional 10.7% |
| Immigrants | North Macedonia | 100.0 /100 | #25 | Exceptional 10.7% |
| Immigrants | India | 100.0 /100 | #26 | Exceptional 10.7% |
| Yugoslavians | 100.0 /100 | #27 | Exceptional 10.7% |
| Somalis | 100.0 /100 | #28 | Exceptional 10.7% |
| Chinese | 99.9 /100 | #29 | Exceptional 10.7% |
| Osage | 99.9 /100 | #30 | Exceptional 10.7% |
| Slovenes | 99.9 /100 | #31 | Exceptional 10.7% |
| Taiwanese | 99.9 /100 | #32 | Exceptional 10.8% |
| Europeans | 99.9 /100 | #33 | Exceptional 10.8% |
| English | 99.9 /100 | #34 | Exceptional 10.8% |
Demographics Similar to Houma by Unemployment Among Youth under 25 years
In terms of unemployment among youth under 25 years, the demographic groups most similar to Houma are Belizean (13.8%, a difference of 0.010%), Immigrants from Sierra Leone (13.8%, a difference of 0.040%), Immigrants from Senegal (13.8%, a difference of 0.090%), Immigrants from Cabo Verde (13.8%, a difference of 0.26%), and Haitian (13.9%, a difference of 0.33%).
| Demographics | Rating | Rank | Unemployment Among Youth under 25 years |
| U.S. Virgin Islanders | 0.0 /100 | #297 | Tragic 13.6% |
| Shoshone | 0.0 /100 | #298 | Tragic 13.7% |
| Tohono O'odham | 0.0 /100 | #299 | Tragic 13.8% |
| Immigrants | Cabo Verde | 0.0 /100 | #300 | Tragic 13.8% |
| Immigrants | Senegal | 0.0 /100 | #301 | Tragic 13.8% |
| Immigrants | Sierra Leone | 0.0 /100 | #302 | Tragic 13.8% |
| Belizeans | 0.0 /100 | #303 | Tragic 13.8% |
| Houma | 0.0 /100 | #304 | Tragic 13.8% |
| Haitians | 0.0 /100 | #305 | Tragic 13.9% |
| Pueblo | 0.0 /100 | #306 | Tragic 13.9% |
| Immigrants | Haiti | 0.0 /100 | #307 | Tragic 14.0% |
| Immigrants | Belize | 0.0 /100 | #308 | Tragic 14.0% |
| Aleuts | 0.0 /100 | #309 | Tragic 14.1% |
| Immigrants | West Indies | 0.0 /100 | #310 | Tragic 14.2% |
| Immigrants | Bangladesh | 0.0 /100 | #311 | Tragic 14.2% |