Yakama vs Guamanian/Chamorro Unemployment Among Ages 30 to 34 years
COMPARE
Yakama
Guamanian/Chamorro
Unemployment Among Ages 30 to 34 years
Unemployment Among Ages 30 to 34 years Comparison
Yakama
Guamanians/Chamorros
9.8%
UNEMPLOYMENT AMONG AGES 30 TO 34 YEARS
0.0/ 100
METRIC RATING
338th/ 347
METRIC RANK
5.8%
UNEMPLOYMENT AMONG AGES 30 TO 34 YEARS
3.9/ 100
METRIC RATING
221st/ 347
METRIC RANK
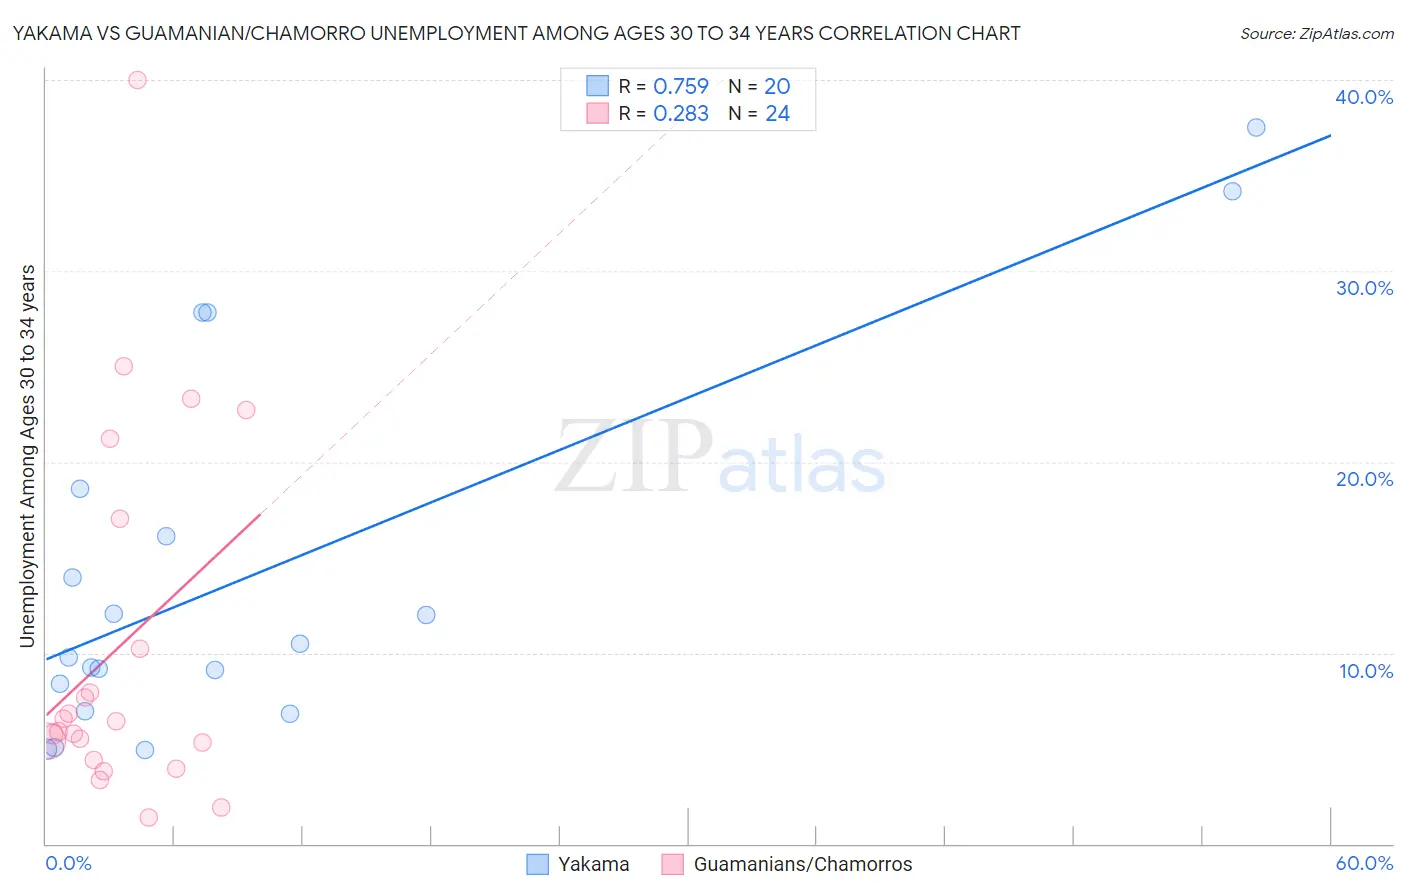
Yakama vs Guamanian/Chamorro Unemployment Among Ages 30 to 34 years Correlation Chart
The statistical analysis conducted on geographies consisting of 19,667,212 people shows a strong positive correlation between the proportion of Yakama and unemployment rate among population between the ages 30 and 34 in the United States with a correlation coefficient (R) of 0.759 and weighted average of 9.8%. Similarly, the statistical analysis conducted on geographies consisting of 215,599,306 people shows a weak positive correlation between the proportion of Guamanians/Chamorros and unemployment rate among population between the ages 30 and 34 in the United States with a correlation coefficient (R) of 0.283 and weighted average of 5.8%, a difference of 69.3%.
Unemployment Among Ages 30 to 34 years Correlation Summary
| Measurement | Yakama | Guamanian/Chamorro |
| Minimum | 4.9% | 1.4% |
| Maximum | 37.5% | 40.0% |
| Range | 32.6% | 38.6% |
| Mean | 14.2% | 10.3% |
| Median | 10.1% | 6.2% |
| Interquartile 25% (IQ1) | 7.7% | 4.8% |
| Interquartile 75% (IQ3) | 17.4% | 13.6% |
| Interquartile Range (IQR) | 9.7% | 8.8% |
| Standard Deviation (Sample) | 9.9% | 9.5% |
| Standard Deviation (Population) | 9.6% | 9.3% |
Similar Demographics by Unemployment Among Ages 30 to 34 years
Demographics Similar to Yakama by Unemployment Among Ages 30 to 34 years
In terms of unemployment among ages 30 to 34 years, the demographic groups most similar to Yakama are Tohono O'odham (9.8%, a difference of 0.71%), Pima (9.6%, a difference of 1.1%), Crow (10.3%, a difference of 6.0%), Colville (9.0%, a difference of 7.9%), and Navajo (10.6%, a difference of 8.1%).
| Demographics | Rating | Rank | Unemployment Among Ages 30 to 34 years |
| Sioux | 0.0 /100 | #331 | Tragic 8.0% |
| Natives/Alaskans | 0.0 /100 | #332 | Tragic 8.2% |
| Pueblo | 0.0 /100 | #333 | Tragic 8.3% |
| Alaska Natives | 0.0 /100 | #334 | Tragic 8.5% |
| Puerto Ricans | 0.0 /100 | #335 | Tragic 8.9% |
| Colville | 0.0 /100 | #336 | Tragic 9.0% |
| Pima | 0.0 /100 | #337 | Tragic 9.6% |
| Yakama | 0.0 /100 | #338 | Tragic 9.8% |
| Tohono O'odham | 0.0 /100 | #339 | Tragic 9.8% |
| Crow | 0.0 /100 | #340 | Tragic 10.3% |
| Navajo | 0.0 /100 | #341 | Tragic 10.6% |
| Yuman | 0.0 /100 | #342 | Tragic 10.6% |
| Inupiat | 0.0 /100 | #343 | Tragic 10.8% |
| Hopi | 0.0 /100 | #344 | Tragic 11.9% |
| Arapaho | 0.0 /100 | #345 | Tragic 12.8% |
Demographics Similar to Guamanians/Chamorros by Unemployment Among Ages 30 to 34 years
In terms of unemployment among ages 30 to 34 years, the demographic groups most similar to Guamanians/Chamorros are Sierra Leonean (5.8%, a difference of 0.020%), French Canadian (5.8%, a difference of 0.23%), Panamanian (5.8%, a difference of 0.26%), Spaniard (5.8%, a difference of 0.33%), and Immigrants from Fiji (5.7%, a difference of 0.47%).
| Demographics | Rating | Rank | Unemployment Among Ages 30 to 34 years |
| Immigrants | Panama | 5.9 /100 | #214 | Tragic 5.7% |
| Immigrants | Cambodia | 5.8 /100 | #215 | Tragic 5.7% |
| Immigrants | Syria | 5.5 /100 | #216 | Tragic 5.7% |
| Immigrants | Fiji | 5.1 /100 | #217 | Tragic 5.7% |
| Panamanians | 4.5 /100 | #218 | Tragic 5.8% |
| French Canadians | 4.4 /100 | #219 | Tragic 5.8% |
| Sierra Leoneans | 3.9 /100 | #220 | Tragic 5.8% |
| Guamanians/Chamorros | 3.9 /100 | #221 | Tragic 5.8% |
| Spaniards | 3.2 /100 | #222 | Tragic 5.8% |
| Bermudans | 2.7 /100 | #223 | Tragic 5.8% |
| Slovaks | 2.5 /100 | #224 | Tragic 5.8% |
| Samoans | 2.5 /100 | #225 | Tragic 5.8% |
| Liberians | 2.3 /100 | #226 | Tragic 5.8% |
| Spanish | 1.8 /100 | #227 | Tragic 5.8% |
| Immigrants | Bahamas | 1.8 /100 | #228 | Tragic 5.8% |