Immigrants from Ghana vs Guamanian/Chamorro Unemployment Among Ages 30 to 34 years
COMPARE
Immigrants from Ghana
Guamanian/Chamorro
Unemployment Among Ages 30 to 34 years
Unemployment Among Ages 30 to 34 years Comparison
Immigrants from Ghana
Guamanians/Chamorros
6.1%
UNEMPLOYMENT AMONG AGES 30 TO 34 YEARS
0.1/ 100
METRIC RATING
256th/ 347
METRIC RANK
5.8%
UNEMPLOYMENT AMONG AGES 30 TO 34 YEARS
3.9/ 100
METRIC RATING
221st/ 347
METRIC RANK
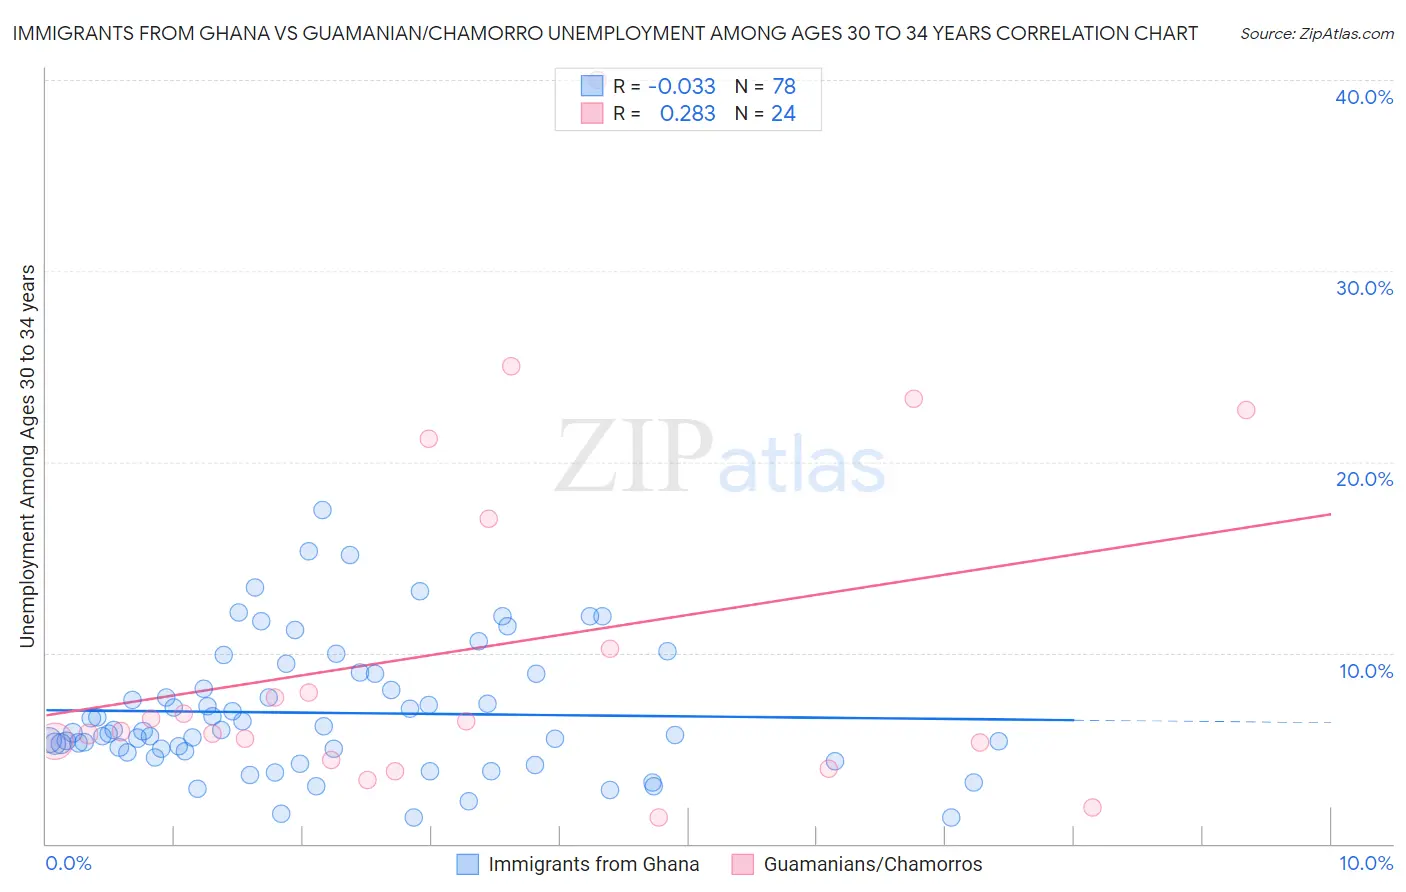
Immigrants from Ghana vs Guamanian/Chamorro Unemployment Among Ages 30 to 34 years Correlation Chart
The statistical analysis conducted on geographies consisting of 195,376,576 people shows no correlation between the proportion of Immigrants from Ghana and unemployment rate among population between the ages 30 and 34 in the United States with a correlation coefficient (R) of -0.033 and weighted average of 6.1%. Similarly, the statistical analysis conducted on geographies consisting of 215,599,306 people shows a weak positive correlation between the proportion of Guamanians/Chamorros and unemployment rate among population between the ages 30 and 34 in the United States with a correlation coefficient (R) of 0.283 and weighted average of 5.8%, a difference of 6.2%.
Unemployment Among Ages 30 to 34 years Correlation Summary
| Measurement | Immigrants from Ghana | Guamanian/Chamorro |
| Minimum | 1.4% | 1.4% |
| Maximum | 17.5% | 40.0% |
| Range | 16.1% | 38.6% |
| Mean | 6.9% | 10.3% |
| Median | 5.8% | 6.2% |
| Interquartile 25% (IQ1) | 4.8% | 4.8% |
| Interquartile 75% (IQ3) | 8.9% | 13.6% |
| Interquartile Range (IQR) | 4.1% | 8.8% |
| Standard Deviation (Sample) | 3.4% | 9.5% |
| Standard Deviation (Population) | 3.4% | 9.3% |
Similar Demographics by Unemployment Among Ages 30 to 34 years
Demographics Similar to Immigrants from Ghana by Unemployment Among Ages 30 to 34 years
In terms of unemployment among ages 30 to 34 years, the demographic groups most similar to Immigrants from Ghana are Immigrants from Sierra Leone (6.1%, a difference of 0.040%), Mexican (6.1%, a difference of 0.10%), Haitian (6.1%, a difference of 0.18%), Immigrants from Portugal (6.1%, a difference of 0.20%), and Immigrants from Latin America (6.1%, a difference of 0.40%).
| Demographics | Rating | Rank | Unemployment Among Ages 30 to 34 years |
| Hondurans | 0.3 /100 | #249 | Tragic 6.0% |
| Immigrants | Honduras | 0.3 /100 | #250 | Tragic 6.0% |
| Tlingit-Haida | 0.2 /100 | #251 | Tragic 6.0% |
| Potawatomi | 0.2 /100 | #252 | Tragic 6.0% |
| Immigrants | Nonimmigrants | 0.2 /100 | #253 | Tragic 6.1% |
| Armenians | 0.1 /100 | #254 | Tragic 6.1% |
| Immigrants | Portugal | 0.1 /100 | #255 | Tragic 6.1% |
| Immigrants | Ghana | 0.1 /100 | #256 | Tragic 6.1% |
| Immigrants | Sierra Leone | 0.1 /100 | #257 | Tragic 6.1% |
| Mexicans | 0.1 /100 | #258 | Tragic 6.1% |
| Haitians | 0.1 /100 | #259 | Tragic 6.1% |
| Immigrants | Latin America | 0.1 /100 | #260 | Tragic 6.1% |
| Immigrants | Western Africa | 0.1 /100 | #261 | Tragic 6.2% |
| Immigrants | Central America | 0.1 /100 | #262 | Tragic 6.2% |
| Spanish Americans | 0.0 /100 | #263 | Tragic 6.2% |
Demographics Similar to Guamanians/Chamorros by Unemployment Among Ages 30 to 34 years
In terms of unemployment among ages 30 to 34 years, the demographic groups most similar to Guamanians/Chamorros are Sierra Leonean (5.8%, a difference of 0.020%), French Canadian (5.8%, a difference of 0.23%), Panamanian (5.8%, a difference of 0.26%), Spaniard (5.8%, a difference of 0.33%), and Immigrants from Fiji (5.7%, a difference of 0.47%).
| Demographics | Rating | Rank | Unemployment Among Ages 30 to 34 years |
| Immigrants | Panama | 5.9 /100 | #214 | Tragic 5.7% |
| Immigrants | Cambodia | 5.8 /100 | #215 | Tragic 5.7% |
| Immigrants | Syria | 5.5 /100 | #216 | Tragic 5.7% |
| Immigrants | Fiji | 5.1 /100 | #217 | Tragic 5.7% |
| Panamanians | 4.5 /100 | #218 | Tragic 5.8% |
| French Canadians | 4.4 /100 | #219 | Tragic 5.8% |
| Sierra Leoneans | 3.9 /100 | #220 | Tragic 5.8% |
| Guamanians/Chamorros | 3.9 /100 | #221 | Tragic 5.8% |
| Spaniards | 3.2 /100 | #222 | Tragic 5.8% |
| Bermudans | 2.7 /100 | #223 | Tragic 5.8% |
| Slovaks | 2.5 /100 | #224 | Tragic 5.8% |
| Samoans | 2.5 /100 | #225 | Tragic 5.8% |
| Liberians | 2.3 /100 | #226 | Tragic 5.8% |
| Spanish | 1.8 /100 | #227 | Tragic 5.8% |
| Immigrants | Bahamas | 1.8 /100 | #228 | Tragic 5.8% |