Welsh vs Immigrants from Chile Unemployment Among Ages 35 to 44 years
COMPARE
Welsh
Immigrants from Chile
Unemployment Among Ages 35 to 44 years
Unemployment Among Ages 35 to 44 years Comparison
Welsh
Immigrants from Chile
4.5%
UNEMPLOYMENT AMONG AGES 35 TO 44 YEARS
91.6/ 100
METRIC RATING
103rd/ 347
METRIC RANK
4.4%
UNEMPLOYMENT AMONG AGES 35 TO 44 YEARS
95.2/ 100
METRIC RATING
84th/ 347
METRIC RANK
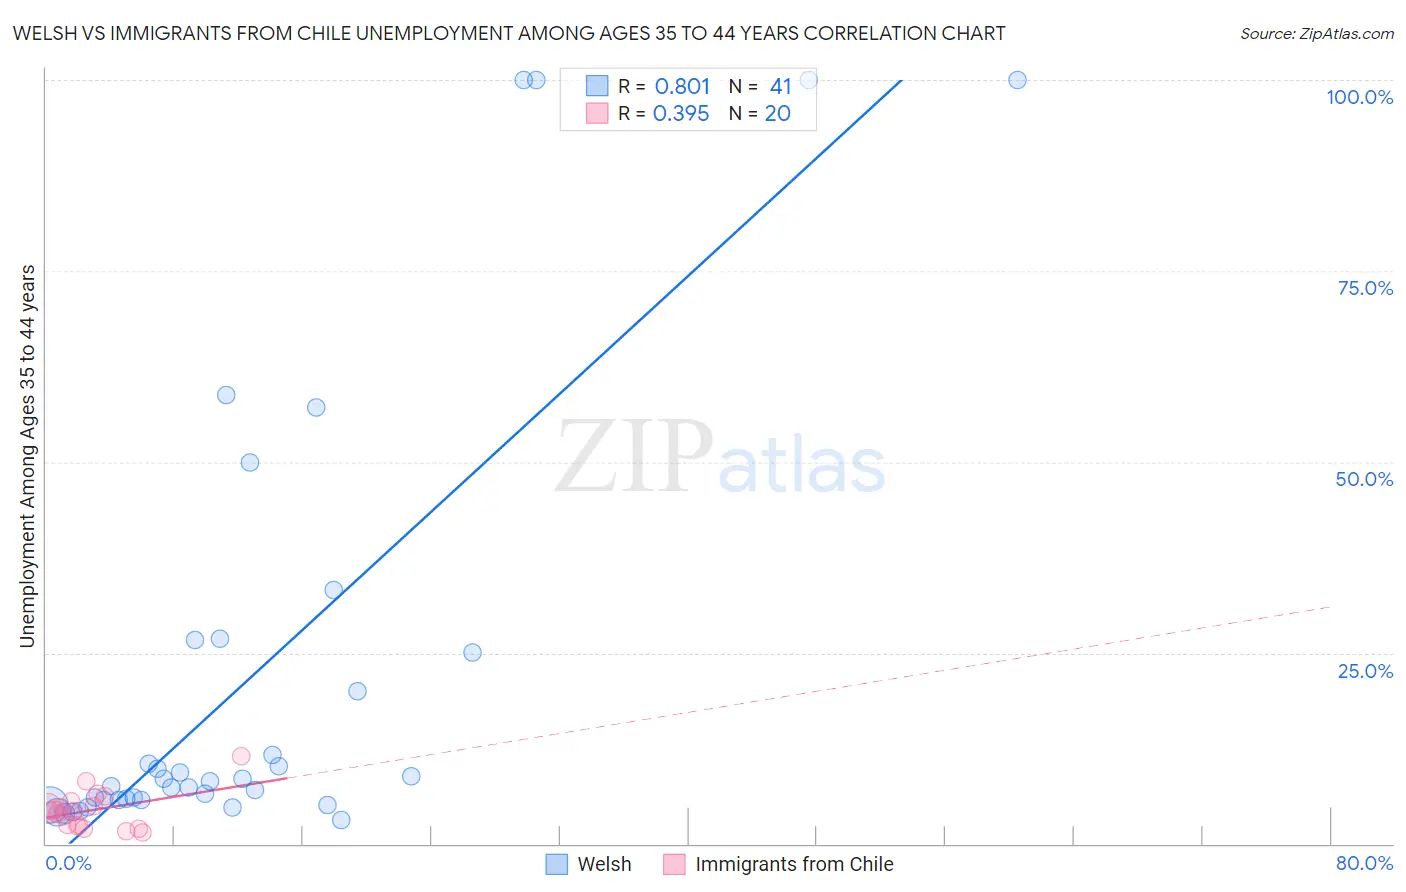
Welsh vs Immigrants from Chile Unemployment Among Ages 35 to 44 years Correlation Chart
The statistical analysis conducted on geographies consisting of 498,709,039 people shows a very strong positive correlation between the proportion of Welsh and unemployment rate among population between the ages 35 and 44 in the United States with a correlation coefficient (R) of 0.801 and weighted average of 4.5%. Similarly, the statistical analysis conducted on geographies consisting of 216,742,242 people shows a mild positive correlation between the proportion of Immigrants from Chile and unemployment rate among population between the ages 35 and 44 in the United States with a correlation coefficient (R) of 0.395 and weighted average of 4.4%, a difference of 1.1%.
Unemployment Among Ages 35 to 44 years Correlation Summary
| Measurement | Welsh | Immigrants from Chile |
| Minimum | 3.1% | 1.5% |
| Maximum | 100.0% | 11.4% |
| Range | 96.9% | 9.9% |
| Mean | 21.8% | 4.4% |
| Median | 8.2% | 4.3% |
| Interquartile 25% (IQ1) | 5.7% | 2.4% |
| Interquartile 75% (IQ3) | 25.8% | 5.3% |
| Interquartile Range (IQR) | 20.1% | 2.9% |
| Standard Deviation (Sample) | 29.5% | 2.4% |
| Standard Deviation (Population) | 29.1% | 2.4% |
Demographics Similar to Welsh and Immigrants from Chile by Unemployment Among Ages 35 to 44 years
In terms of unemployment among ages 35 to 44 years, the demographic groups most similar to Welsh are Immigrants from Sudan (4.5%, a difference of 0.030%), Immigrants from Netherlands (4.5%, a difference of 0.060%), Italian (4.5%, a difference of 0.070%), Immigrants from Egypt (4.5%, a difference of 0.16%), and Immigrants from Canada (4.5%, a difference of 0.17%). Similarly, the demographic groups most similar to Immigrants from Chile are Immigrants from Australia (4.4%, a difference of 0.040%), Immigrants from Kenya (4.4%, a difference of 0.080%), Serbian (4.4%, a difference of 0.12%), Immigrants from Bosnia and Herzegovina (4.4%, a difference of 0.15%), and Immigrants from Latvia (4.4%, a difference of 0.17%).
| Demographics | Rating | Rank | Unemployment Among Ages 35 to 44 years |
| Immigrants | Australia | 95.3 /100 | #83 | Exceptional 4.4% |
| Immigrants | Chile | 95.2 /100 | #84 | Exceptional 4.4% |
| Immigrants | Kenya | 95.0 /100 | #85 | Exceptional 4.4% |
| Serbians | 94.9 /100 | #86 | Exceptional 4.4% |
| Immigrants | Bosnia and Herzegovina | 94.8 /100 | #87 | Exceptional 4.4% |
| Immigrants | Latvia | 94.8 /100 | #88 | Exceptional 4.4% |
| Egyptians | 94.5 /100 | #89 | Exceptional 4.5% |
| Australians | 94.5 /100 | #90 | Exceptional 4.5% |
| Immigrants | Northern Europe | 94.3 /100 | #91 | Exceptional 4.5% |
| Estonians | 94.3 /100 | #92 | Exceptional 4.5% |
| Iranians | 93.9 /100 | #93 | Exceptional 4.5% |
| Russians | 93.8 /100 | #94 | Exceptional 4.5% |
| Yugoslavians | 93.6 /100 | #95 | Exceptional 4.5% |
| Scottish | 93.5 /100 | #96 | Exceptional 4.5% |
| Immigrants | France | 92.5 /100 | #97 | Exceptional 4.5% |
| Immigrants | Canada | 92.3 /100 | #98 | Exceptional 4.5% |
| Immigrants | Egypt | 92.3 /100 | #99 | Exceptional 4.5% |
| Italians | 91.9 /100 | #100 | Exceptional 4.5% |
| Immigrants | Netherlands | 91.9 /100 | #101 | Exceptional 4.5% |
| Immigrants | Sudan | 91.8 /100 | #102 | Exceptional 4.5% |
| Welsh | 91.6 /100 | #103 | Exceptional 4.5% |