Venezuelan vs Salvadoran Female Unemployment
COMPARE
Venezuelan
Salvadoran
Female Unemployment
Female Unemployment Comparison
Venezuelans
Salvadorans
5.0%
FEMALE UNEMPLOYMENT
96.9/ 100
METRIC RATING
87th/ 347
METRIC RANK
6.0%
FEMALE UNEMPLOYMENT
0.0/ 100
METRIC RATING
283rd/ 347
METRIC RANK
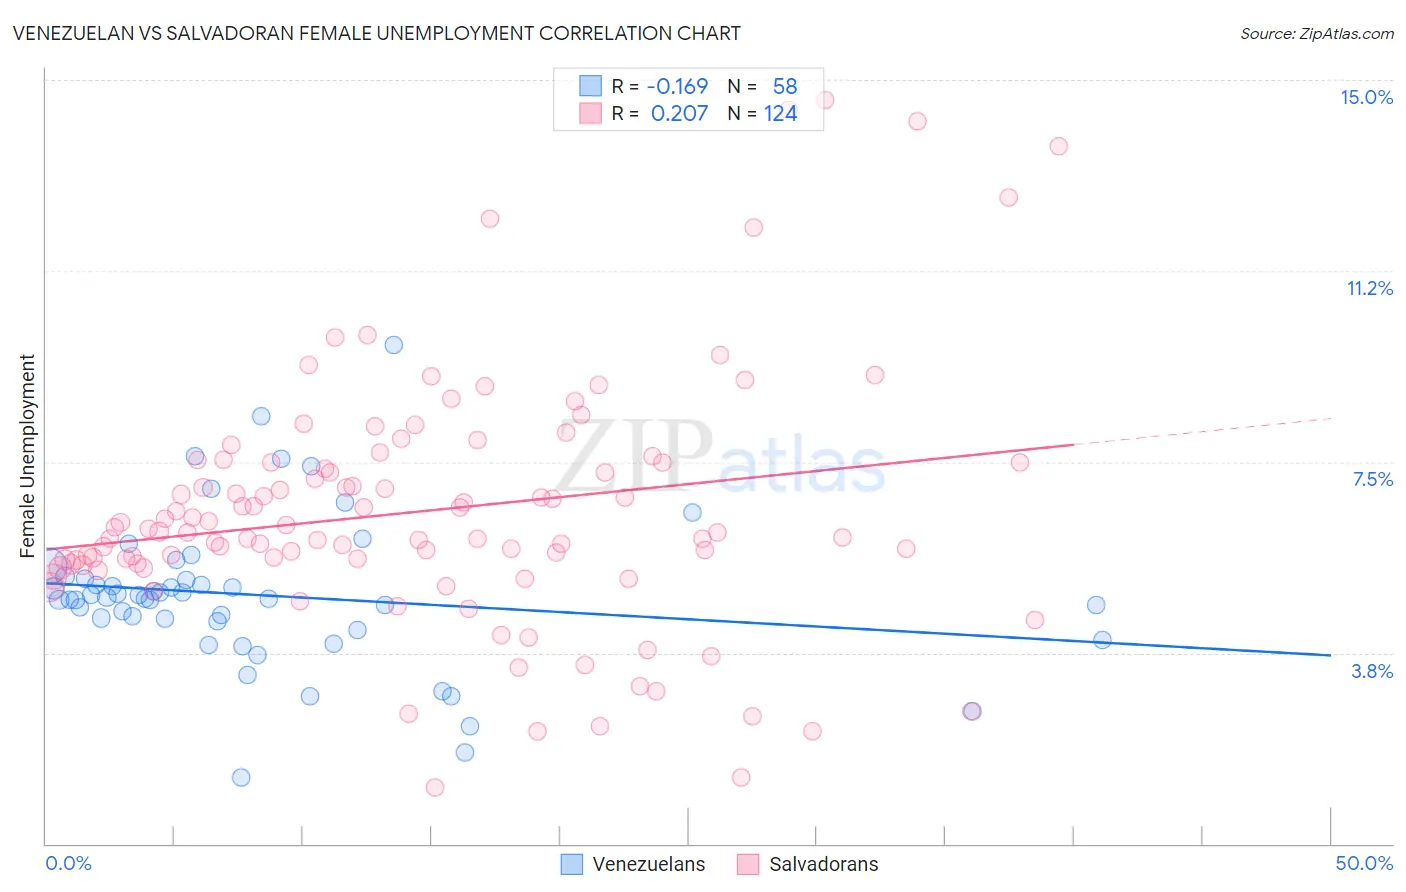
Venezuelan vs Salvadoran Female Unemployment Correlation Chart
The statistical analysis conducted on geographies consisting of 305,755,404 people shows a poor negative correlation between the proportion of Venezuelans and unemploymnet rate among females in the United States with a correlation coefficient (R) of -0.169 and weighted average of 5.0%. Similarly, the statistical analysis conducted on geographies consisting of 397,211,124 people shows a weak positive correlation between the proportion of Salvadorans and unemploymnet rate among females in the United States with a correlation coefficient (R) of 0.207 and weighted average of 6.0%, a difference of 21.1%.
Female Unemployment Correlation Summary
| Measurement | Venezuelan | Salvadoran |
| Minimum | 1.3% | 1.1% |
| Maximum | 9.8% | 14.6% |
| Range | 8.5% | 13.5% |
| Mean | 4.9% | 6.5% |
| Median | 4.8% | 6.1% |
| Interquartile 25% (IQ1) | 4.4% | 5.5% |
| Interquartile 75% (IQ3) | 5.2% | 7.5% |
| Interquartile Range (IQR) | 0.83% | 2.0% |
| Standard Deviation (Sample) | 1.5% | 2.4% |
| Standard Deviation (Population) | 1.5% | 2.4% |
Similar Demographics by Female Unemployment
Demographics Similar to Venezuelans by Female Unemployment
In terms of female unemployment, the demographic groups most similar to Venezuelans are Bolivian (5.0%, a difference of 0.090%), Immigrants from Sudan (5.0%, a difference of 0.090%), Ukrainian (5.0%, a difference of 0.10%), Canadian (5.0%, a difference of 0.14%), and Immigrants from Taiwan (5.0%, a difference of 0.15%).
| Demographics | Rating | Rank | Female Unemployment |
| New Zealanders | 97.4 /100 | #80 | Exceptional 5.0% |
| Filipinos | 97.3 /100 | #81 | Exceptional 5.0% |
| Immigrants | Australia | 97.3 /100 | #82 | Exceptional 5.0% |
| Immigrants | Serbia | 97.2 /100 | #83 | Exceptional 5.0% |
| Canadians | 97.2 /100 | #84 | Exceptional 5.0% |
| Ukrainians | 97.1 /100 | #85 | Exceptional 5.0% |
| Bolivians | 97.1 /100 | #86 | Exceptional 5.0% |
| Venezuelans | 96.9 /100 | #87 | Exceptional 5.0% |
| Immigrants | Sudan | 96.7 /100 | #88 | Exceptional 5.0% |
| Immigrants | Taiwan | 96.6 /100 | #89 | Exceptional 5.0% |
| Immigrants | Sweden | 96.3 /100 | #90 | Exceptional 5.0% |
| Immigrants | Japan | 96.0 /100 | #91 | Exceptional 5.0% |
| Romanians | 95.9 /100 | #92 | Exceptional 5.0% |
| Immigrants | Austria | 95.7 /100 | #93 | Exceptional 5.0% |
| Immigrants | Malaysia | 95.7 /100 | #94 | Exceptional 5.0% |
Demographics Similar to Salvadorans by Female Unemployment
In terms of female unemployment, the demographic groups most similar to Salvadorans are Colville (6.0%, a difference of 0.10%), Immigrants from Senegal (6.1%, a difference of 0.34%), Guatemalan (6.0%, a difference of 0.37%), Mexican American Indian (6.0%, a difference of 0.41%), and Armenian (6.0%, a difference of 0.47%).
| Demographics | Rating | Rank | Female Unemployment |
| Bahamians | 0.0 /100 | #276 | Tragic 6.0% |
| Immigrants | Ghana | 0.0 /100 | #277 | Tragic 6.0% |
| Yaqui | 0.0 /100 | #278 | Tragic 6.0% |
| Armenians | 0.0 /100 | #279 | Tragic 6.0% |
| Mexican American Indians | 0.0 /100 | #280 | Tragic 6.0% |
| Guatemalans | 0.0 /100 | #281 | Tragic 6.0% |
| Colville | 0.0 /100 | #282 | Tragic 6.0% |
| Salvadorans | 0.0 /100 | #283 | Tragic 6.0% |
| Immigrants | Senegal | 0.0 /100 | #284 | Tragic 6.1% |
| Immigrants | Cabo Verde | 0.0 /100 | #285 | Tragic 6.1% |
| Chippewa | 0.0 /100 | #286 | Tragic 6.1% |
| Immigrants | Guatemala | 0.0 /100 | #287 | Tragic 6.1% |
| Haitians | 0.0 /100 | #288 | Tragic 6.1% |
| Trinidadians and Tobagonians | 0.0 /100 | #289 | Tragic 6.1% |
| Immigrants | Caribbean | 0.0 /100 | #290 | Tragic 6.1% |