Venezuelan vs Immigrants from Fiji Female Unemployment
COMPARE
Venezuelan
Immigrants from Fiji
Female Unemployment
Female Unemployment Comparison
Venezuelans
Immigrants from Fiji
5.0%
FEMALE UNEMPLOYMENT
96.9/ 100
METRIC RATING
87th/ 347
METRIC RANK
5.8%
FEMALE UNEMPLOYMENT
0.2/ 100
METRIC RATING
259th/ 347
METRIC RANK
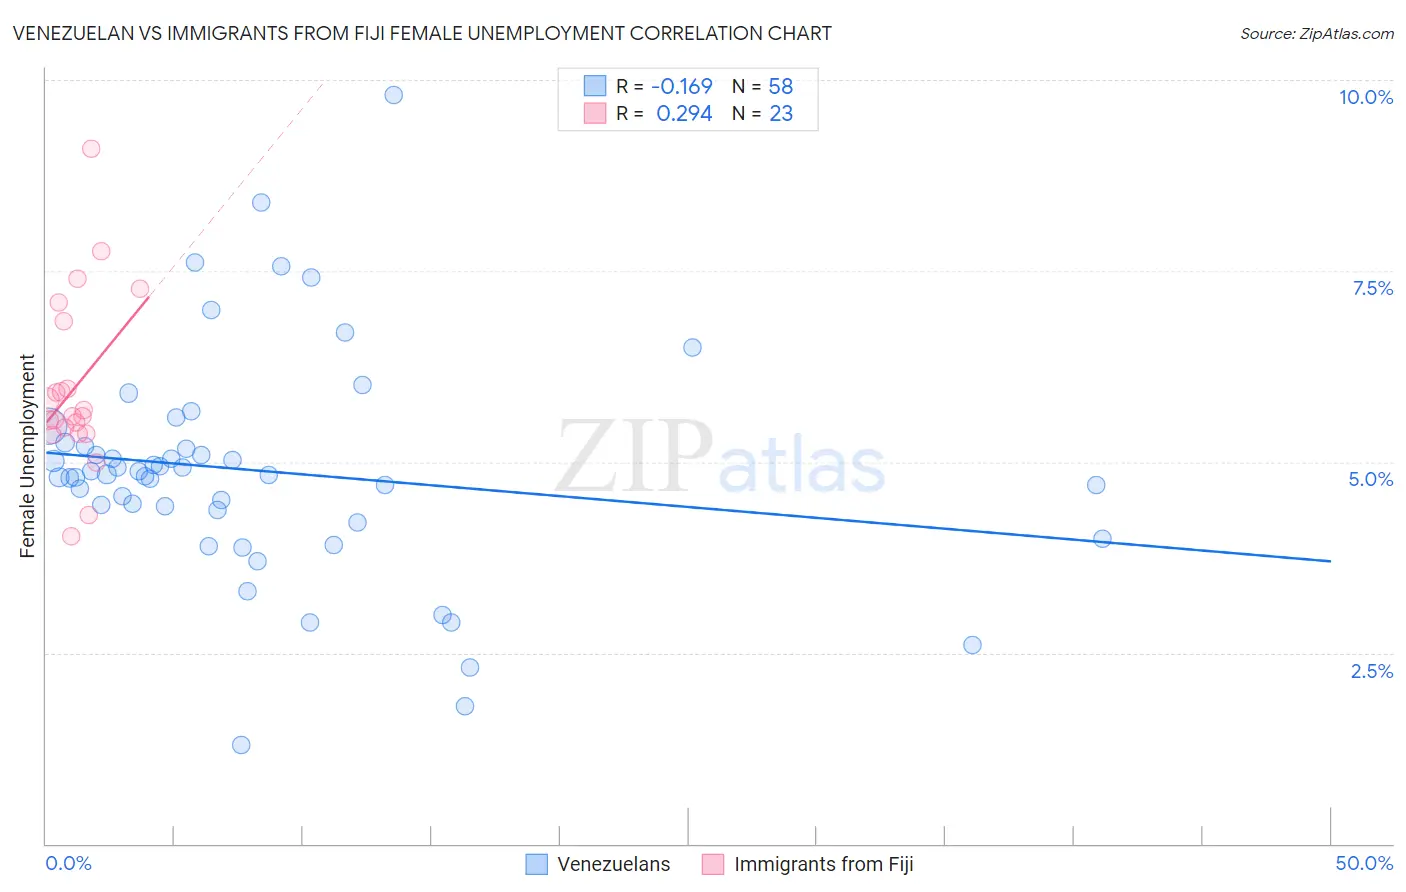
Venezuelan vs Immigrants from Fiji Female Unemployment Correlation Chart
The statistical analysis conducted on geographies consisting of 305,755,404 people shows a poor negative correlation between the proportion of Venezuelans and unemploymnet rate among females in the United States with a correlation coefficient (R) of -0.169 and weighted average of 5.0%. Similarly, the statistical analysis conducted on geographies consisting of 93,721,389 people shows a weak positive correlation between the proportion of Immigrants from Fiji and unemploymnet rate among females in the United States with a correlation coefficient (R) of 0.294 and weighted average of 5.8%, a difference of 15.5%.
Female Unemployment Correlation Summary
| Measurement | Venezuelan | Immigrants from Fiji |
| Minimum | 1.3% | 4.0% |
| Maximum | 9.8% | 9.1% |
| Range | 8.5% | 5.1% |
| Mean | 4.9% | 6.0% |
| Median | 4.8% | 5.6% |
| Interquartile 25% (IQ1) | 4.4% | 5.4% |
| Interquartile 75% (IQ3) | 5.2% | 6.8% |
| Interquartile Range (IQR) | 0.83% | 1.5% |
| Standard Deviation (Sample) | 1.5% | 1.1% |
| Standard Deviation (Population) | 1.5% | 1.1% |
Similar Demographics by Female Unemployment
Demographics Similar to Venezuelans by Female Unemployment
In terms of female unemployment, the demographic groups most similar to Venezuelans are Bolivian (5.0%, a difference of 0.090%), Immigrants from Sudan (5.0%, a difference of 0.090%), Ukrainian (5.0%, a difference of 0.10%), Canadian (5.0%, a difference of 0.14%), and Immigrants from Taiwan (5.0%, a difference of 0.15%).
| Demographics | Rating | Rank | Female Unemployment |
| New Zealanders | 97.4 /100 | #80 | Exceptional 5.0% |
| Filipinos | 97.3 /100 | #81 | Exceptional 5.0% |
| Immigrants | Australia | 97.3 /100 | #82 | Exceptional 5.0% |
| Immigrants | Serbia | 97.2 /100 | #83 | Exceptional 5.0% |
| Canadians | 97.2 /100 | #84 | Exceptional 5.0% |
| Ukrainians | 97.1 /100 | #85 | Exceptional 5.0% |
| Bolivians | 97.1 /100 | #86 | Exceptional 5.0% |
| Venezuelans | 96.9 /100 | #87 | Exceptional 5.0% |
| Immigrants | Sudan | 96.7 /100 | #88 | Exceptional 5.0% |
| Immigrants | Taiwan | 96.6 /100 | #89 | Exceptional 5.0% |
| Immigrants | Sweden | 96.3 /100 | #90 | Exceptional 5.0% |
| Immigrants | Japan | 96.0 /100 | #91 | Exceptional 5.0% |
| Romanians | 95.9 /100 | #92 | Exceptional 5.0% |
| Immigrants | Austria | 95.7 /100 | #93 | Exceptional 5.0% |
| Immigrants | Malaysia | 95.7 /100 | #94 | Exceptional 5.0% |
Demographics Similar to Immigrants from Fiji by Female Unemployment
In terms of female unemployment, the demographic groups most similar to Immigrants from Fiji are Nigerian (5.8%, a difference of 0.040%), Immigrants from Portugal (5.8%, a difference of 0.11%), Kiowa (5.8%, a difference of 0.30%), Immigrants from Nigeria (5.8%, a difference of 0.33%), and Dutch West Indian (5.7%, a difference of 0.91%).
| Demographics | Rating | Rank | Female Unemployment |
| Cajuns | 0.7 /100 | #252 | Tragic 5.7% |
| Immigrants | Sierra Leone | 0.6 /100 | #253 | Tragic 5.7% |
| Immigrants | Immigrants | 0.6 /100 | #254 | Tragic 5.7% |
| Immigrants | Cameroon | 0.6 /100 | #255 | Tragic 5.7% |
| Sub-Saharan Africans | 0.4 /100 | #256 | Tragic 5.7% |
| Dutch West Indians | 0.3 /100 | #257 | Tragic 5.7% |
| Immigrants | Portugal | 0.2 /100 | #258 | Tragic 5.8% |
| Immigrants | Fiji | 0.2 /100 | #259 | Tragic 5.8% |
| Nigerians | 0.2 /100 | #260 | Tragic 5.8% |
| Kiowa | 0.1 /100 | #261 | Tragic 5.8% |
| Immigrants | Nigeria | 0.1 /100 | #262 | Tragic 5.8% |
| Immigrants | Azores | 0.1 /100 | #263 | Tragic 5.8% |
| Immigrants | Bahamas | 0.1 /100 | #264 | Tragic 5.8% |
| Blackfeet | 0.0 /100 | #265 | Tragic 5.9% |
| Cape Verdeans | 0.0 /100 | #266 | Tragic 5.9% |