Venezuelan vs Immigrants from Micronesia Unemployment Among Seniors over 75 years
COMPARE
Venezuelan
Immigrants from Micronesia
Unemployment Among Seniors over 75 years
Unemployment Among Seniors over 75 years Comparison
Venezuelans
Immigrants from Micronesia
8.1%
UNEMPLOYMENT AMONG SENIORS OVER 75 YEARS
99.5/ 100
METRIC RATING
92nd/ 347
METRIC RANK
8.8%
UNEMPLOYMENT AMONG SENIORS OVER 75 YEARS
37.2/ 100
METRIC RATING
184th/ 347
METRIC RANK
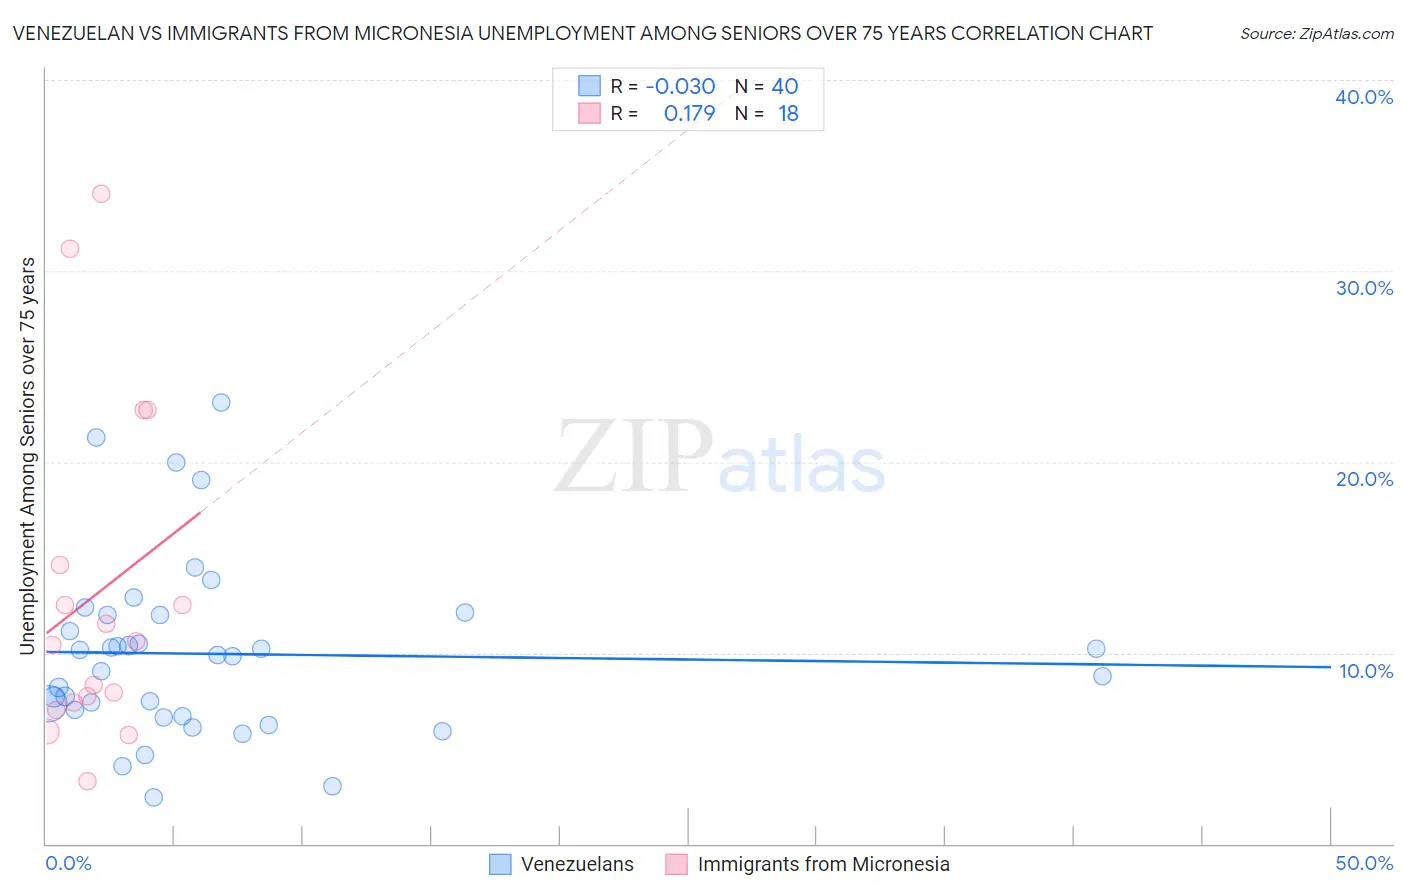
Venezuelan vs Immigrants from Micronesia Unemployment Among Seniors over 75 years Correlation Chart
The statistical analysis conducted on geographies consisting of 170,728,330 people shows no correlation between the proportion of Venezuelans and unemployment rate among seniors over the age of 75 in the United States with a correlation coefficient (R) of -0.030 and weighted average of 8.1%. Similarly, the statistical analysis conducted on geographies consisting of 48,327,887 people shows a poor positive correlation between the proportion of Immigrants from Micronesia and unemployment rate among seniors over the age of 75 in the United States with a correlation coefficient (R) of 0.179 and weighted average of 8.8%, a difference of 8.3%.
Unemployment Among Seniors over 75 years Correlation Summary
| Measurement | Venezuelan | Immigrants from Micronesia |
| Minimum | 2.4% | 3.3% |
| Maximum | 23.1% | 34.1% |
| Range | 20.7% | 30.8% |
| Mean | 9.9% | 13.1% |
| Median | 9.8% | 10.5% |
| Interquartile 25% (IQ1) | 6.8% | 7.4% |
| Interquartile 75% (IQ3) | 12.0% | 14.6% |
| Interquartile Range (IQR) | 5.2% | 7.2% |
| Standard Deviation (Sample) | 4.7% | 8.8% |
| Standard Deviation (Population) | 4.6% | 8.6% |
Similar Demographics by Unemployment Among Seniors over 75 years
Demographics Similar to Venezuelans by Unemployment Among Seniors over 75 years
In terms of unemployment among seniors over 75 years, the demographic groups most similar to Venezuelans are Egyptian (8.1%, a difference of 0.0%), Immigrants from Vietnam (8.1%, a difference of 0.050%), Immigrants from Netherlands (8.1%, a difference of 0.080%), Immigrants from Ireland (8.1%, a difference of 0.11%), and Immigrants from Korea (8.1%, a difference of 0.12%).
| Demographics | Rating | Rank | Unemployment Among Seniors over 75 years |
| Immigrants | Indonesia | 99.7 /100 | #85 | Exceptional 8.1% |
| Immigrants | Singapore | 99.7 /100 | #86 | Exceptional 8.1% |
| Basques | 99.5 /100 | #87 | Exceptional 8.1% |
| New Zealanders | 99.5 /100 | #88 | Exceptional 8.1% |
| Immigrants | Korea | 99.5 /100 | #89 | Exceptional 8.1% |
| Immigrants | Vietnam | 99.5 /100 | #90 | Exceptional 8.1% |
| Egyptians | 99.5 /100 | #91 | Exceptional 8.1% |
| Venezuelans | 99.5 /100 | #92 | Exceptional 8.1% |
| Immigrants | Netherlands | 99.5 /100 | #93 | Exceptional 8.1% |
| Immigrants | Ireland | 99.4 /100 | #94 | Exceptional 8.1% |
| Nicaraguans | 99.3 /100 | #95 | Exceptional 8.2% |
| Immigrants | Belgium | 99.3 /100 | #96 | Exceptional 8.2% |
| Immigrants | Sri Lanka | 99.3 /100 | #97 | Exceptional 8.2% |
| Immigrants | Northern Africa | 99.3 /100 | #98 | Exceptional 8.2% |
| Burmese | 99.2 /100 | #99 | Exceptional 8.2% |
Demographics Similar to Immigrants from Micronesia by Unemployment Among Seniors over 75 years
In terms of unemployment among seniors over 75 years, the demographic groups most similar to Immigrants from Micronesia are Choctaw (8.8%, a difference of 0.0%), Immigrants from Afghanistan (8.8%, a difference of 0.060%), Immigrants from Ethiopia (8.8%, a difference of 0.060%), Immigrants from Europe (8.8%, a difference of 0.11%), and Guatemalan (8.8%, a difference of 0.13%).
| Demographics | Rating | Rank | Unemployment Among Seniors over 75 years |
| Central Americans | 43.3 /100 | #177 | Average 8.8% |
| West Indians | 41.9 /100 | #178 | Average 8.8% |
| Immigrants | Italy | 41.7 /100 | #179 | Average 8.8% |
| Immigrants | Somalia | 41.7 /100 | #180 | Average 8.8% |
| Immigrants | Thailand | 40.2 /100 | #181 | Average 8.8% |
| Guatemalans | 39.5 /100 | #182 | Fair 8.8% |
| Immigrants | Afghanistan | 38.2 /100 | #183 | Fair 8.8% |
| Immigrants | Micronesia | 37.2 /100 | #184 | Fair 8.8% |
| Choctaw | 37.1 /100 | #185 | Fair 8.8% |
| Immigrants | Ethiopia | 36.2 /100 | #186 | Fair 8.8% |
| Immigrants | Europe | 35.2 /100 | #187 | Fair 8.8% |
| Immigrants | Eastern Europe | 34.7 /100 | #188 | Fair 8.8% |
| Immigrants | Haiti | 34.7 /100 | #189 | Fair 8.8% |
| Mexican American Indians | 34.7 /100 | #190 | Fair 8.8% |
| Estonians | 33.3 /100 | #191 | Fair 8.8% |