Immigrants from Guyana vs Immigrants from Micronesia Unemployment Among Seniors over 75 years
COMPARE
Immigrants from Guyana
Immigrants from Micronesia
Unemployment Among Seniors over 75 years
Unemployment Among Seniors over 75 years Comparison
Immigrants from Guyana
Immigrants from Micronesia
8.8%
UNEMPLOYMENT AMONG SENIORS OVER 75 YEARS
29.9/ 100
METRIC RATING
193rd/ 347
METRIC RANK
8.8%
UNEMPLOYMENT AMONG SENIORS OVER 75 YEARS
37.2/ 100
METRIC RATING
184th/ 347
METRIC RANK
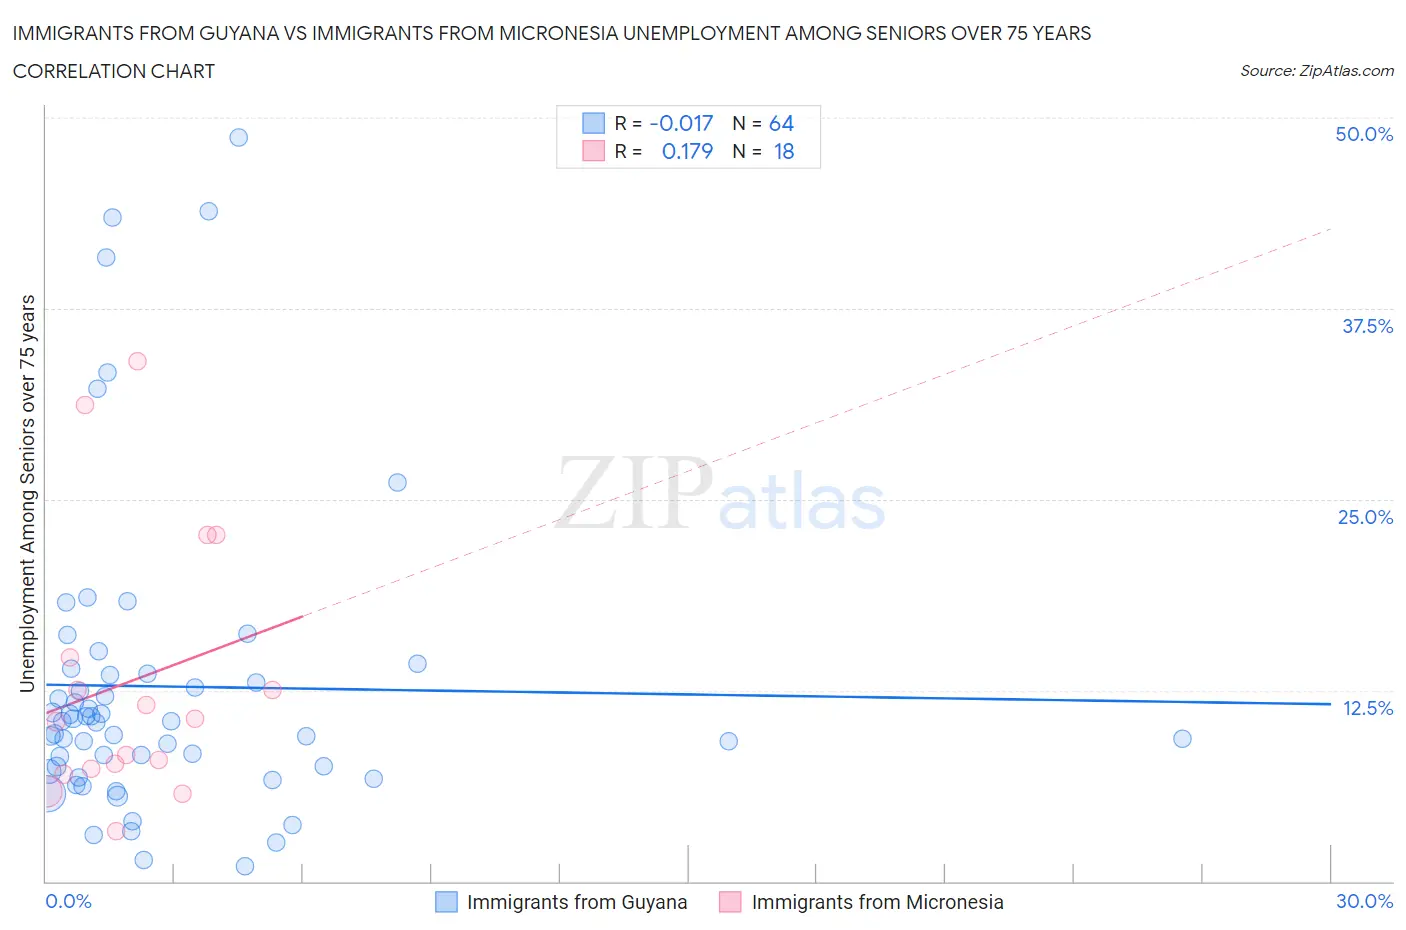
Immigrants from Guyana vs Immigrants from Micronesia Unemployment Among Seniors over 75 years Correlation Chart
The statistical analysis conducted on geographies consisting of 117,930,233 people shows no correlation between the proportion of Immigrants from Guyana and unemployment rate among seniors over the age of 75 in the United States with a correlation coefficient (R) of -0.017 and weighted average of 8.8%. Similarly, the statistical analysis conducted on geographies consisting of 48,327,887 people shows a poor positive correlation between the proportion of Immigrants from Micronesia and unemployment rate among seniors over the age of 75 in the United States with a correlation coefficient (R) of 0.179 and weighted average of 8.8%, a difference of 0.43%.
Unemployment Among Seniors over 75 years Correlation Summary
| Measurement | Immigrants from Guyana | Immigrants from Micronesia |
| Minimum | 1.0% | 3.3% |
| Maximum | 48.7% | 34.1% |
| Range | 47.7% | 30.8% |
| Mean | 12.8% | 13.1% |
| Median | 10.4% | 10.5% |
| Interquartile 25% (IQ1) | 7.3% | 7.4% |
| Interquartile 75% (IQ3) | 13.6% | 14.6% |
| Interquartile Range (IQR) | 6.2% | 7.2% |
| Standard Deviation (Sample) | 10.1% | 8.8% |
| Standard Deviation (Population) | 10.1% | 8.6% |
Demographics Similar to Immigrants from Guyana and Immigrants from Micronesia by Unemployment Among Seniors over 75 years
In terms of unemployment among seniors over 75 years, the demographic groups most similar to Immigrants from Guyana are Maltese (8.8%, a difference of 0.050%), Okinawan (8.8%, a difference of 0.070%), Immigrants from Kenya (8.8%, a difference of 0.12%), Immigrants from Jamaica (8.9%, a difference of 0.14%), and Estonian (8.8%, a difference of 0.20%). Similarly, the demographic groups most similar to Immigrants from Micronesia are Choctaw (8.8%, a difference of 0.0%), Immigrants from Afghanistan (8.8%, a difference of 0.060%), Immigrants from Ethiopia (8.8%, a difference of 0.060%), Immigrants from Europe (8.8%, a difference of 0.11%), and Guatemalan (8.8%, a difference of 0.13%).
| Demographics | Rating | Rank | Unemployment Among Seniors over 75 years |
| West Indians | 41.9 /100 | #178 | Average 8.8% |
| Immigrants | Italy | 41.7 /100 | #179 | Average 8.8% |
| Immigrants | Somalia | 41.7 /100 | #180 | Average 8.8% |
| Immigrants | Thailand | 40.2 /100 | #181 | Average 8.8% |
| Guatemalans | 39.5 /100 | #182 | Fair 8.8% |
| Immigrants | Afghanistan | 38.2 /100 | #183 | Fair 8.8% |
| Immigrants | Micronesia | 37.2 /100 | #184 | Fair 8.8% |
| Choctaw | 37.1 /100 | #185 | Fair 8.8% |
| Immigrants | Ethiopia | 36.2 /100 | #186 | Fair 8.8% |
| Immigrants | Europe | 35.2 /100 | #187 | Fair 8.8% |
| Immigrants | Eastern Europe | 34.7 /100 | #188 | Fair 8.8% |
| Immigrants | Haiti | 34.7 /100 | #189 | Fair 8.8% |
| Mexican American Indians | 34.7 /100 | #190 | Fair 8.8% |
| Estonians | 33.3 /100 | #191 | Fair 8.8% |
| Immigrants | Kenya | 31.8 /100 | #192 | Fair 8.8% |
| Immigrants | Guyana | 29.9 /100 | #193 | Fair 8.8% |
| Maltese | 29.2 /100 | #194 | Fair 8.8% |
| Okinawans | 28.9 /100 | #195 | Fair 8.8% |
| Immigrants | Jamaica | 27.7 /100 | #196 | Fair 8.9% |
| Immigrants | Laos | 26.3 /100 | #197 | Fair 8.9% |
| Eastern Europeans | 25.9 /100 | #198 | Fair 8.9% |