Uruguayan vs Immigrants from Syria Unemployment Among Ages 65 to 74 years
COMPARE
Uruguayan
Immigrants from Syria
Unemployment Among Ages 65 to 74 years
Unemployment Among Ages 65 to 74 years Comparison
Uruguayans
Immigrants from Syria
5.5%
UNEMPLOYMENT AMONG AGES 65 TO 74 YEARS
6.2/ 100
METRIC RATING
216th/ 347
METRIC RANK
5.5%
UNEMPLOYMENT AMONG AGES 65 TO 74 YEARS
5.1/ 100
METRIC RATING
220th/ 347
METRIC RANK
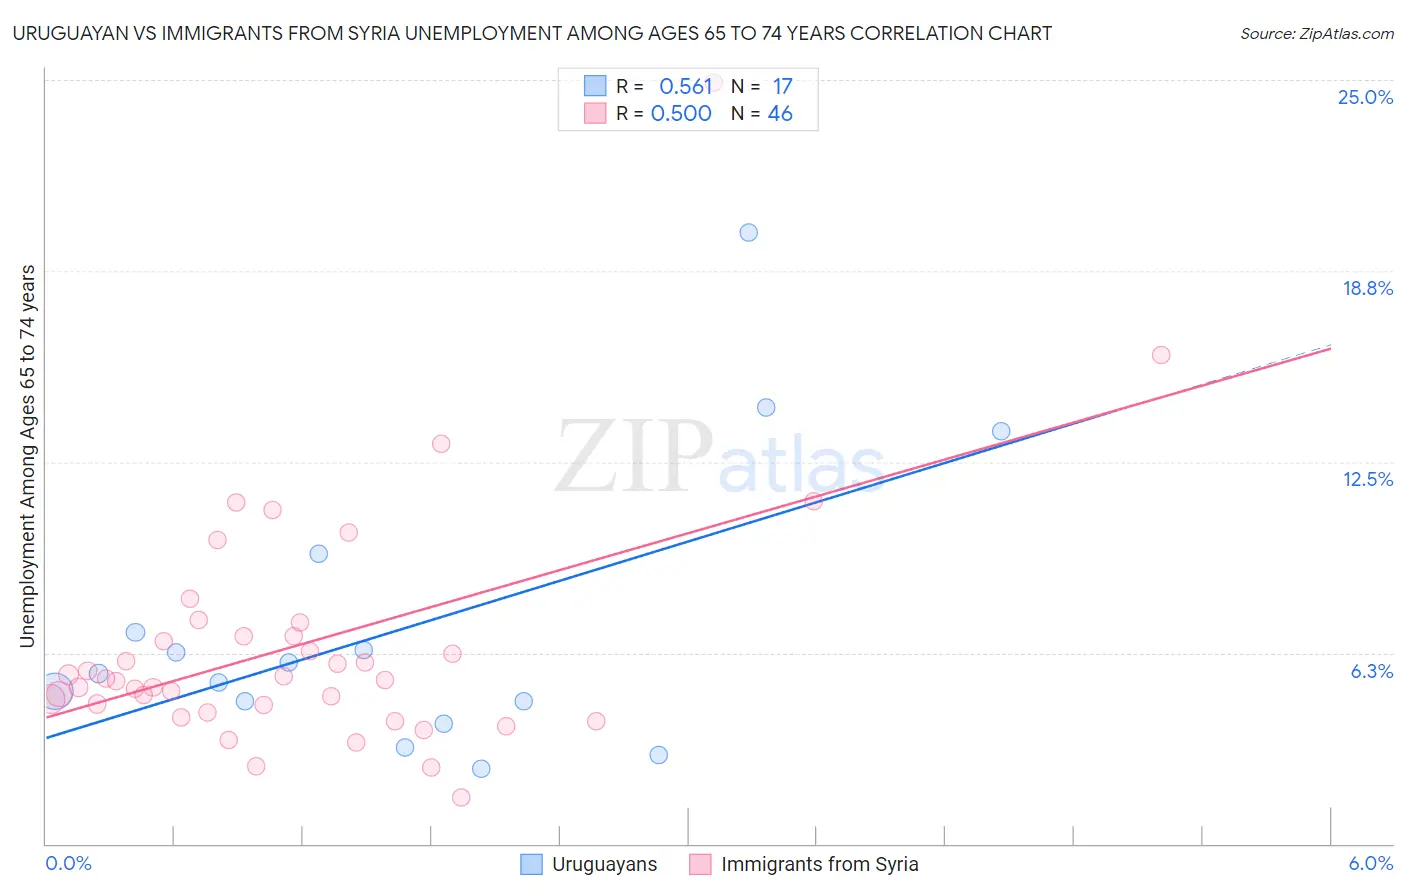
Uruguayan vs Immigrants from Syria Unemployment Among Ages 65 to 74 years Correlation Chart
The statistical analysis conducted on geographies consisting of 138,083,265 people shows a substantial positive correlation between the proportion of Uruguayans and unemployment rate among population between the ages 65 and 74 in the United States with a correlation coefficient (R) of 0.561 and weighted average of 5.5%. Similarly, the statistical analysis conducted on geographies consisting of 165,795,272 people shows a substantial positive correlation between the proportion of Immigrants from Syria and unemployment rate among population between the ages 65 and 74 in the United States with a correlation coefficient (R) of 0.500 and weighted average of 5.5%, a difference of 0.18%.
Unemployment Among Ages 65 to 74 years Correlation Summary
| Measurement | Uruguayan | Immigrants from Syria |
| Minimum | 2.5% | 1.5% |
| Maximum | 20.0% | 24.9% |
| Range | 17.5% | 23.4% |
| Mean | 7.1% | 6.5% |
| Median | 5.6% | 5.4% |
| Interquartile 25% (IQ1) | 4.3% | 4.5% |
| Interquartile 75% (IQ3) | 8.2% | 6.8% |
| Interquartile Range (IQR) | 3.9% | 2.3% |
| Standard Deviation (Sample) | 4.7% | 4.0% |
| Standard Deviation (Population) | 4.6% | 3.9% |
Demographics Similar to Uruguayans and Immigrants from Syria by Unemployment Among Ages 65 to 74 years
In terms of unemployment among ages 65 to 74 years, the demographic groups most similar to Uruguayans are Blackfeet (5.5%, a difference of 0.060%), Samoan (5.5%, a difference of 0.080%), Alsatian (5.5%, a difference of 0.10%), American (5.5%, a difference of 0.13%), and Egyptian (5.5%, a difference of 0.17%). Similarly, the demographic groups most similar to Immigrants from Syria are Spaniard (5.5%, a difference of 0.050%), Alsatian (5.5%, a difference of 0.080%), Apache (5.5%, a difference of 0.090%), Samoan (5.5%, a difference of 0.10%), and Hungarian (5.5%, a difference of 0.11%).
| Demographics | Rating | Rank | Unemployment Among Ages 65 to 74 years |
| Dutch West Indians | 11.5 /100 | #208 | Poor 5.5% |
| Immigrants | Honduras | 10.4 /100 | #209 | Poor 5.5% |
| Immigrants | Northern Africa | 10.1 /100 | #210 | Poor 5.5% |
| Immigrants | Croatia | 9.1 /100 | #211 | Tragic 5.5% |
| Haitians | 7.7 /100 | #212 | Tragic 5.5% |
| Italians | 7.7 /100 | #213 | Tragic 5.5% |
| Egyptians | 7.6 /100 | #214 | Tragic 5.5% |
| Americans | 7.3 /100 | #215 | Tragic 5.5% |
| Uruguayans | 6.2 /100 | #216 | Tragic 5.5% |
| Blackfeet | 5.8 /100 | #217 | Tragic 5.5% |
| Samoans | 5.7 /100 | #218 | Tragic 5.5% |
| Alsatians | 5.6 /100 | #219 | Tragic 5.5% |
| Immigrants | Syria | 5.1 /100 | #220 | Tragic 5.5% |
| Spaniards | 4.8 /100 | #221 | Tragic 5.5% |
| Apache | 4.5 /100 | #222 | Tragic 5.5% |
| Hungarians | 4.4 /100 | #223 | Tragic 5.5% |
| Immigrants | Uruguay | 4.2 /100 | #224 | Tragic 5.5% |
| Immigrants | Trinidad and Tobago | 4.1 /100 | #225 | Tragic 5.5% |
| Hondurans | 3.7 /100 | #226 | Tragic 5.5% |
| Immigrants | Albania | 3.7 /100 | #227 | Tragic 5.5% |
| Immigrants | Israel | 3.0 /100 | #228 | Tragic 5.5% |