Bermudan vs Immigrants from Syria Unemployment Among Ages 65 to 74 years
COMPARE
Bermudan
Immigrants from Syria
Unemployment Among Ages 65 to 74 years
Unemployment Among Ages 65 to 74 years Comparison
Bermudans
Immigrants from Syria
6.3%
UNEMPLOYMENT AMONG AGES 65 TO 74 YEARS
0.0/ 100
METRIC RATING
331st/ 347
METRIC RANK
5.5%
UNEMPLOYMENT AMONG AGES 65 TO 74 YEARS
5.1/ 100
METRIC RATING
220th/ 347
METRIC RANK
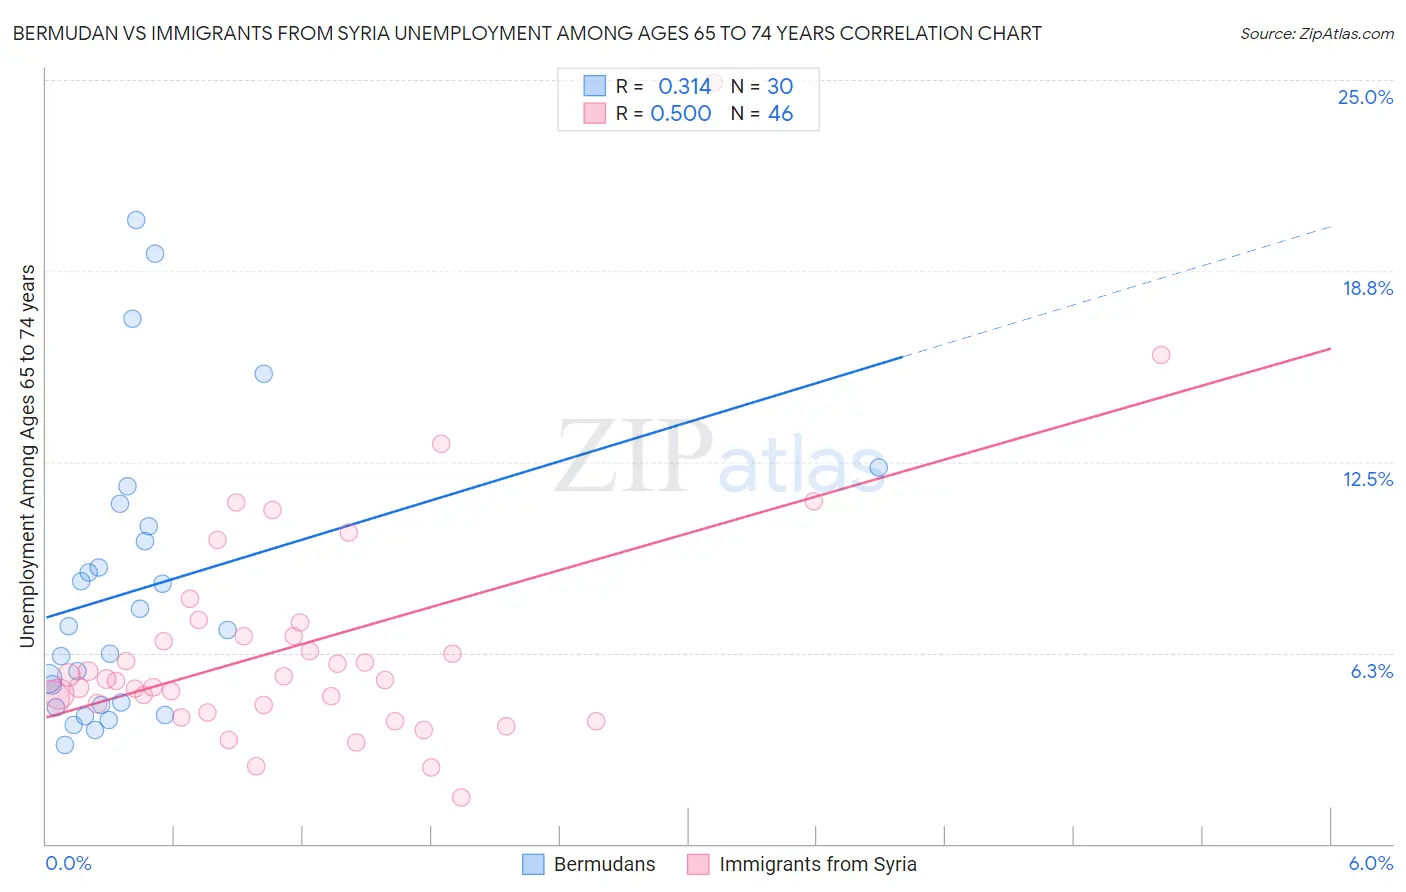
Bermudan vs Immigrants from Syria Unemployment Among Ages 65 to 74 years Correlation Chart
The statistical analysis conducted on geographies consisting of 54,099,424 people shows a mild positive correlation between the proportion of Bermudans and unemployment rate among population between the ages 65 and 74 in the United States with a correlation coefficient (R) of 0.314 and weighted average of 6.3%. Similarly, the statistical analysis conducted on geographies consisting of 165,795,272 people shows a substantial positive correlation between the proportion of Immigrants from Syria and unemployment rate among population between the ages 65 and 74 in the United States with a correlation coefficient (R) of 0.500 and weighted average of 5.5%, a difference of 14.1%.
Unemployment Among Ages 65 to 74 years Correlation Summary
| Measurement | Bermudan | Immigrants from Syria |
| Minimum | 3.2% | 1.5% |
| Maximum | 20.4% | 24.9% |
| Range | 17.2% | 23.4% |
| Mean | 8.3% | 6.5% |
| Median | 7.1% | 5.4% |
| Interquartile 25% (IQ1) | 4.5% | 4.5% |
| Interquartile 75% (IQ3) | 10.4% | 6.8% |
| Interquartile Range (IQR) | 5.9% | 2.3% |
| Standard Deviation (Sample) | 4.7% | 4.0% |
| Standard Deviation (Population) | 4.6% | 3.9% |
Similar Demographics by Unemployment Among Ages 65 to 74 years
Demographics Similar to Bermudans by Unemployment Among Ages 65 to 74 years
In terms of unemployment among ages 65 to 74 years, the demographic groups most similar to Bermudans are Dominican (6.3%, a difference of 0.14%), Immigrants from Dominican Republic (6.3%, a difference of 0.32%), Paiute (6.3%, a difference of 0.42%), Yuman (6.2%, a difference of 0.45%), and Taiwanese (6.3%, a difference of 0.53%).
| Demographics | Rating | Rank | Unemployment Among Ages 65 to 74 years |
| Tohono O'odham | 0.0 /100 | #324 | Tragic 6.0% |
| Immigrants | Portugal | 0.0 /100 | #325 | Tragic 6.0% |
| Natives/Alaskans | 0.0 /100 | #326 | Tragic 6.0% |
| Shoshone | 0.0 /100 | #327 | Tragic 6.2% |
| Immigrants | Azores | 0.0 /100 | #328 | Tragic 6.2% |
| Yuman | 0.0 /100 | #329 | Tragic 6.2% |
| Dominicans | 0.0 /100 | #330 | Tragic 6.3% |
| Bermudans | 0.0 /100 | #331 | Tragic 6.3% |
| Immigrants | Dominican Republic | 0.0 /100 | #332 | Tragic 6.3% |
| Paiute | 0.0 /100 | #333 | Tragic 6.3% |
| Taiwanese | 0.0 /100 | #334 | Tragic 6.3% |
| Puerto Ricans | 0.0 /100 | #335 | Tragic 6.4% |
| Immigrants | Armenia | 0.0 /100 | #336 | Tragic 6.5% |
| Ute | 0.0 /100 | #337 | Tragic 6.5% |
| Tlingit-Haida | 0.0 /100 | #338 | Tragic 6.5% |
Demographics Similar to Immigrants from Syria by Unemployment Among Ages 65 to 74 years
In terms of unemployment among ages 65 to 74 years, the demographic groups most similar to Immigrants from Syria are Spaniard (5.5%, a difference of 0.050%), Alsatian (5.5%, a difference of 0.080%), Apache (5.5%, a difference of 0.090%), Samoan (5.5%, a difference of 0.10%), and Hungarian (5.5%, a difference of 0.11%).
| Demographics | Rating | Rank | Unemployment Among Ages 65 to 74 years |
| Italians | 7.7 /100 | #213 | Tragic 5.5% |
| Egyptians | 7.6 /100 | #214 | Tragic 5.5% |
| Americans | 7.3 /100 | #215 | Tragic 5.5% |
| Uruguayans | 6.2 /100 | #216 | Tragic 5.5% |
| Blackfeet | 5.8 /100 | #217 | Tragic 5.5% |
| Samoans | 5.7 /100 | #218 | Tragic 5.5% |
| Alsatians | 5.6 /100 | #219 | Tragic 5.5% |
| Immigrants | Syria | 5.1 /100 | #220 | Tragic 5.5% |
| Spaniards | 4.8 /100 | #221 | Tragic 5.5% |
| Apache | 4.5 /100 | #222 | Tragic 5.5% |
| Hungarians | 4.4 /100 | #223 | Tragic 5.5% |
| Immigrants | Uruguay | 4.2 /100 | #224 | Tragic 5.5% |
| Immigrants | Trinidad and Tobago | 4.1 /100 | #225 | Tragic 5.5% |
| Hondurans | 3.7 /100 | #226 | Tragic 5.5% |
| Immigrants | Albania | 3.7 /100 | #227 | Tragic 5.5% |