Ugandan vs Spanish Unemployment Among Ages 30 to 34 years
COMPARE
Ugandan
Spanish
Unemployment Among Ages 30 to 34 years
Unemployment Among Ages 30 to 34 years Comparison
Ugandans
Spanish
4.9%
UNEMPLOYMENT AMONG AGES 30 TO 34 YEARS
99.7/ 100
METRIC RATING
24th/ 347
METRIC RANK
5.8%
UNEMPLOYMENT AMONG AGES 30 TO 34 YEARS
1.8/ 100
METRIC RATING
227th/ 347
METRIC RANK
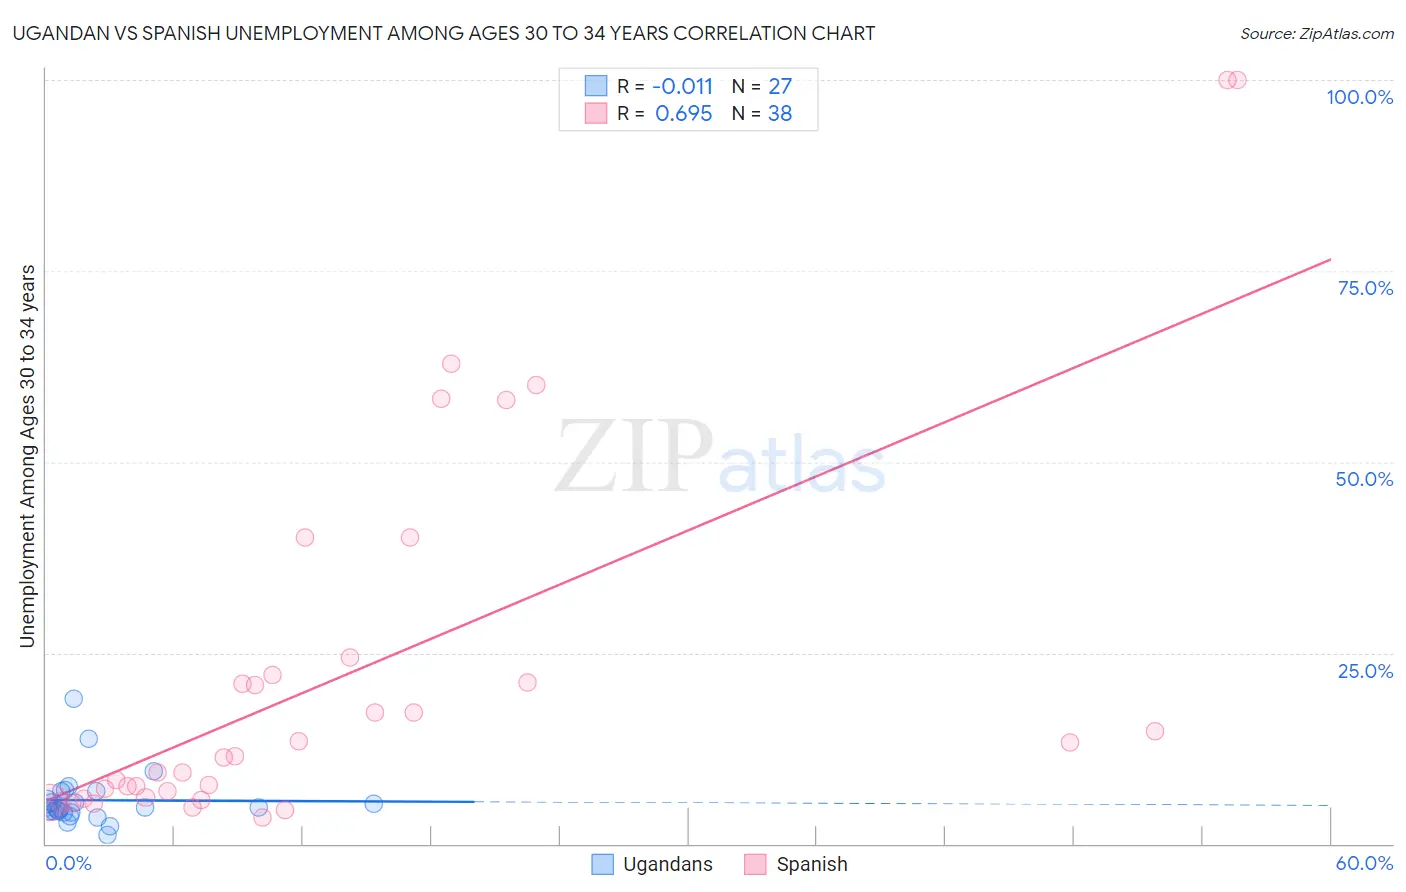
Ugandan vs Spanish Unemployment Among Ages 30 to 34 years Correlation Chart
The statistical analysis conducted on geographies consisting of 92,893,290 people shows no correlation between the proportion of Ugandans and unemployment rate among population between the ages 30 and 34 in the United States with a correlation coefficient (R) of -0.011 and weighted average of 4.9%. Similarly, the statistical analysis conducted on geographies consisting of 396,032,865 people shows a significant positive correlation between the proportion of Spanish and unemployment rate among population between the ages 30 and 34 in the United States with a correlation coefficient (R) of 0.695 and weighted average of 5.8%, a difference of 18.9%.
Unemployment Among Ages 30 to 34 years Correlation Summary
| Measurement | Ugandan | Spanish |
| Minimum | 1.1% | 3.4% |
| Maximum | 19.0% | 100.0% |
| Range | 17.9% | 96.6% |
| Mean | 5.7% | 22.2% |
| Median | 4.7% | 11.4% |
| Interquartile 25% (IQ1) | 4.2% | 6.1% |
| Interquartile 75% (IQ3) | 6.8% | 22.1% |
| Interquartile Range (IQR) | 2.6% | 16.0% |
| Standard Deviation (Sample) | 3.6% | 25.2% |
| Standard Deviation (Population) | 3.5% | 24.8% |
Similar Demographics by Unemployment Among Ages 30 to 34 years
Demographics Similar to Ugandans by Unemployment Among Ages 30 to 34 years
In terms of unemployment among ages 30 to 34 years, the demographic groups most similar to Ugandans are Hmong (4.9%, a difference of 0.55%), Immigrants from South Central Asia (4.9%, a difference of 0.73%), Immigrants from Singapore (5.0%, a difference of 0.92%), Ethiopian (4.9%, a difference of 0.94%), and Immigrants from Taiwan (4.9%, a difference of 0.95%).
| Demographics | Rating | Rank | Unemployment Among Ages 30 to 34 years |
| Immigrants | Bulgaria | 99.9 /100 | #17 | Exceptional 4.8% |
| Bolivians | 99.8 /100 | #18 | Exceptional 4.9% |
| Immigrants | Sudan | 99.8 /100 | #19 | Exceptional 4.9% |
| Immigrants | Taiwan | 99.8 /100 | #20 | Exceptional 4.9% |
| Ethiopians | 99.8 /100 | #21 | Exceptional 4.9% |
| Immigrants | South Central Asia | 99.8 /100 | #22 | Exceptional 4.9% |
| Hmong | 99.8 /100 | #23 | Exceptional 4.9% |
| Ugandans | 99.7 /100 | #24 | Exceptional 4.9% |
| Immigrants | Singapore | 99.5 /100 | #25 | Exceptional 5.0% |
| Immigrants | Kuwait | 99.5 /100 | #26 | Exceptional 5.0% |
| Danes | 99.5 /100 | #27 | Exceptional 5.0% |
| Immigrants | Cuba | 99.4 /100 | #28 | Exceptional 5.0% |
| German Russians | 99.4 /100 | #29 | Exceptional 5.0% |
| Norwegians | 99.4 /100 | #30 | Exceptional 5.0% |
| Somalis | 99.3 /100 | #31 | Exceptional 5.0% |
Demographics Similar to Spanish by Unemployment Among Ages 30 to 34 years
In terms of unemployment among ages 30 to 34 years, the demographic groups most similar to Spanish are Immigrants from Bahamas (5.8%, a difference of 0.080%), Liberian (5.8%, a difference of 0.35%), Immigrants from Uzbekistan (5.9%, a difference of 0.39%), Samoan (5.8%, a difference of 0.47%), and Slovak (5.8%, a difference of 0.50%).
| Demographics | Rating | Rank | Unemployment Among Ages 30 to 34 years |
| Sierra Leoneans | 3.9 /100 | #220 | Tragic 5.8% |
| Guamanians/Chamorros | 3.9 /100 | #221 | Tragic 5.8% |
| Spaniards | 3.2 /100 | #222 | Tragic 5.8% |
| Bermudans | 2.7 /100 | #223 | Tragic 5.8% |
| Slovaks | 2.5 /100 | #224 | Tragic 5.8% |
| Samoans | 2.5 /100 | #225 | Tragic 5.8% |
| Liberians | 2.3 /100 | #226 | Tragic 5.8% |
| Spanish | 1.8 /100 | #227 | Tragic 5.8% |
| Immigrants | Bahamas | 1.8 /100 | #228 | Tragic 5.8% |
| Immigrants | Uzbekistan | 1.5 /100 | #229 | Tragic 5.9% |
| Hawaiians | 1.2 /100 | #230 | Tragic 5.9% |
| Japanese | 1.1 /100 | #231 | Tragic 5.9% |
| Iroquois | 1.0 /100 | #232 | Tragic 5.9% |
| Nepalese | 0.8 /100 | #233 | Tragic 5.9% |
| Portuguese | 0.8 /100 | #234 | Tragic 5.9% |