Ugandan vs Spanish 5th Grade
COMPARE
Ugandan
Spanish
5th Grade
5th Grade Comparison
Ugandans
Spanish
97.4%
5TH GRADE
58.9/ 100
METRIC RATING
163rd/ 347
METRIC RANK
97.6%
5TH GRADE
93.7/ 100
METRIC RATING
124th/ 347
METRIC RANK
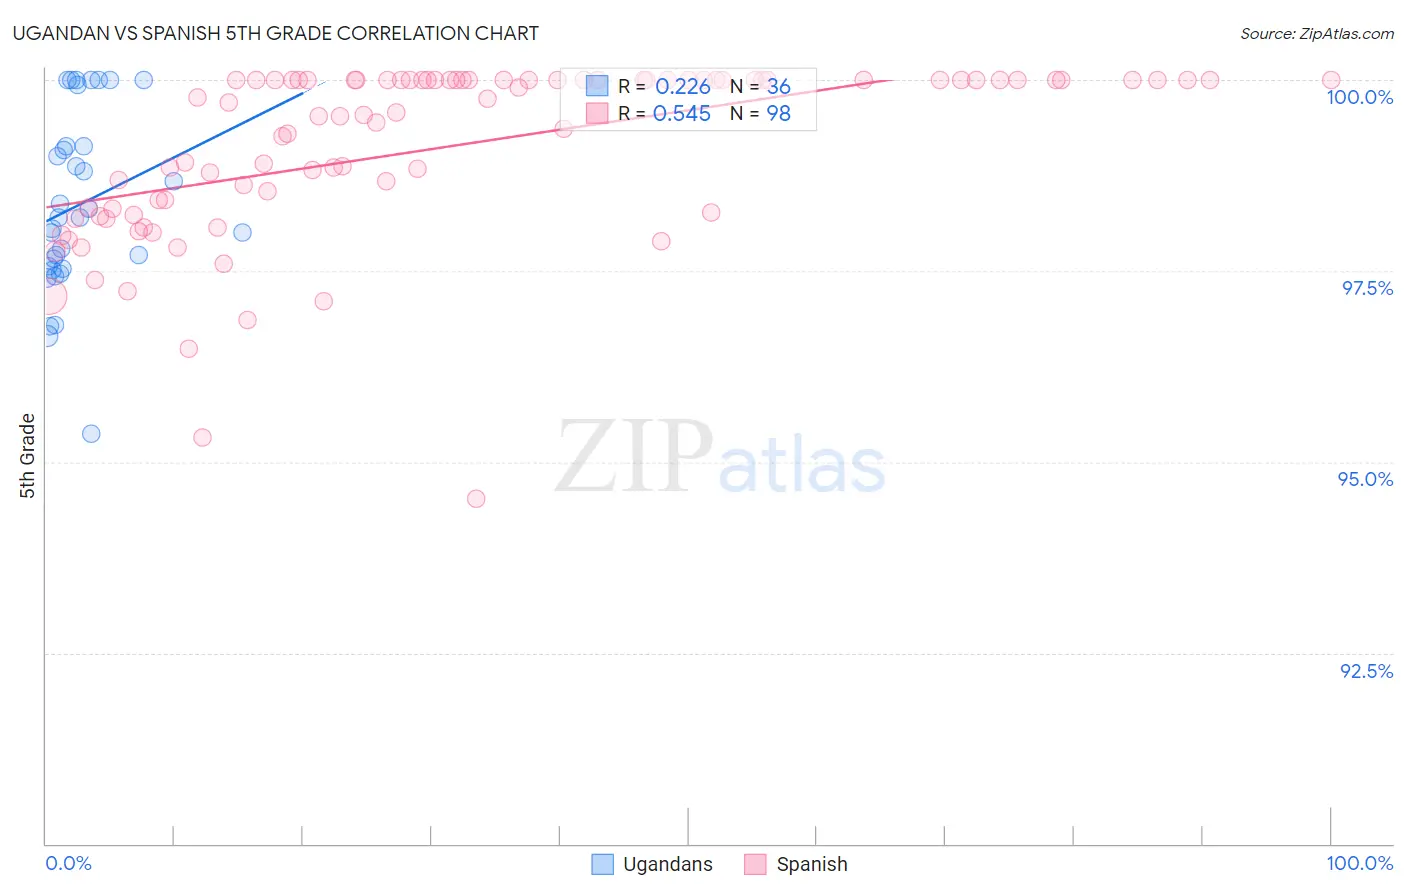
Ugandan vs Spanish 5th Grade Correlation Chart
The statistical analysis conducted on geographies consisting of 93,991,892 people shows a weak positive correlation between the proportion of Ugandans and percentage of population with at least 5th grade education in the United States with a correlation coefficient (R) of 0.226 and weighted average of 97.4%. Similarly, the statistical analysis conducted on geographies consisting of 422,189,188 people shows a substantial positive correlation between the proportion of Spanish and percentage of population with at least 5th grade education in the United States with a correlation coefficient (R) of 0.545 and weighted average of 97.6%, a difference of 0.24%.
5th Grade Correlation Summary
| Measurement | Ugandan | Spanish |
| Minimum | 95.4% | 94.5% |
| Maximum | 100.0% | 100.0% |
| Range | 4.6% | 5.5% |
| Mean | 98.4% | 99.1% |
| Median | 98.2% | 99.7% |
| Interquartile 25% (IQ1) | 97.5% | 98.3% |
| Interquartile 75% (IQ3) | 99.1% | 100.0% |
| Interquartile Range (IQR) | 1.6% | 1.7% |
| Standard Deviation (Sample) | 1.2% | 1.1% |
| Standard Deviation (Population) | 1.1% | 1.1% |
Similar Demographics by 5th Grade
Demographics Similar to Ugandans by 5th Grade
In terms of 5th grade, the demographic groups most similar to Ugandans are Kenyan (97.4%, a difference of 0.0%), Immigrants from Iran (97.4%, a difference of 0.0%), Bermudan (97.4%, a difference of 0.0%), Immigrants from Poland (97.4%, a difference of 0.0%), and Marshallese (97.4%, a difference of 0.010%).
| Demographics | Rating | Rank | 5th Grade |
| French American Indians | 70.5 /100 | #156 | Good 97.4% |
| Immigrants | Jordan | 70.4 /100 | #157 | Good 97.4% |
| Albanians | 68.3 /100 | #158 | Good 97.4% |
| Immigrants | Italy | 65.2 /100 | #159 | Good 97.4% |
| Marshallese | 61.2 /100 | #160 | Good 97.4% |
| Kenyans | 59.7 /100 | #161 | Average 97.4% |
| Immigrants | Iran | 59.5 /100 | #162 | Average 97.4% |
| Ugandans | 58.9 /100 | #163 | Average 97.4% |
| Bermudans | 58.8 /100 | #164 | Average 97.4% |
| Immigrants | Poland | 57.9 /100 | #165 | Average 97.4% |
| Apache | 57.2 /100 | #166 | Average 97.4% |
| Immigrants | Belarus | 54.6 /100 | #167 | Average 97.3% |
| Chileans | 54.5 /100 | #168 | Average 97.3% |
| Immigrants | Korea | 54.1 /100 | #169 | Average 97.3% |
| Venezuelans | 54.0 /100 | #170 | Average 97.3% |
Demographics Similar to Spanish by 5th Grade
In terms of 5th grade, the demographic groups most similar to Spanish are Immigrants from Bulgaria (97.6%, a difference of 0.010%), Immigrants from Zimbabwe (97.6%, a difference of 0.020%), Immigrants from France (97.6%, a difference of 0.020%), Immigrants from Japan (97.6%, a difference of 0.020%), and Immigrants from Norway (97.6%, a difference of 0.020%).
| Demographics | Rating | Rank | 5th Grade |
| Immigrants | Saudi Arabia | 95.4 /100 | #117 | Exceptional 97.6% |
| Basques | 95.2 /100 | #118 | Exceptional 97.6% |
| Syrians | 95.1 /100 | #119 | Exceptional 97.6% |
| Immigrants | Zimbabwe | 94.9 /100 | #120 | Exceptional 97.6% |
| Immigrants | France | 94.8 /100 | #121 | Exceptional 97.6% |
| Immigrants | Japan | 94.7 /100 | #122 | Exceptional 97.6% |
| Immigrants | Norway | 94.6 /100 | #123 | Exceptional 97.6% |
| Spanish | 93.7 /100 | #124 | Exceptional 97.6% |
| Immigrants | Bulgaria | 93.1 /100 | #125 | Exceptional 97.6% |
| Hmong | 92.3 /100 | #126 | Exceptional 97.6% |
| Immigrants | Serbia | 92.3 /100 | #127 | Exceptional 97.6% |
| Colville | 92.0 /100 | #128 | Exceptional 97.6% |
| Immigrants | Europe | 91.9 /100 | #129 | Exceptional 97.6% |
| Immigrants | Romania | 91.6 /100 | #130 | Exceptional 97.6% |
| Pima | 91.2 /100 | #131 | Exceptional 97.6% |