Trinidadian and Tobagonian vs Immigrants from Western Asia Unemployment Among Seniors over 65 years
COMPARE
Trinidadian and Tobagonian
Immigrants from Western Asia
Unemployment Among Seniors over 65 years
Unemployment Among Seniors over 65 years Comparison
Trinidadians and Tobagonians
Immigrants from Western Asia
5.4%
UNEMPLOYMENT AMONG SENIORS OVER 65 YEARS
0.6/ 100
METRIC RATING
252nd/ 347
METRIC RANK
5.2%
UNEMPLOYMENT AMONG SENIORS OVER 65 YEARS
42.1/ 100
METRIC RATING
183rd/ 347
METRIC RANK
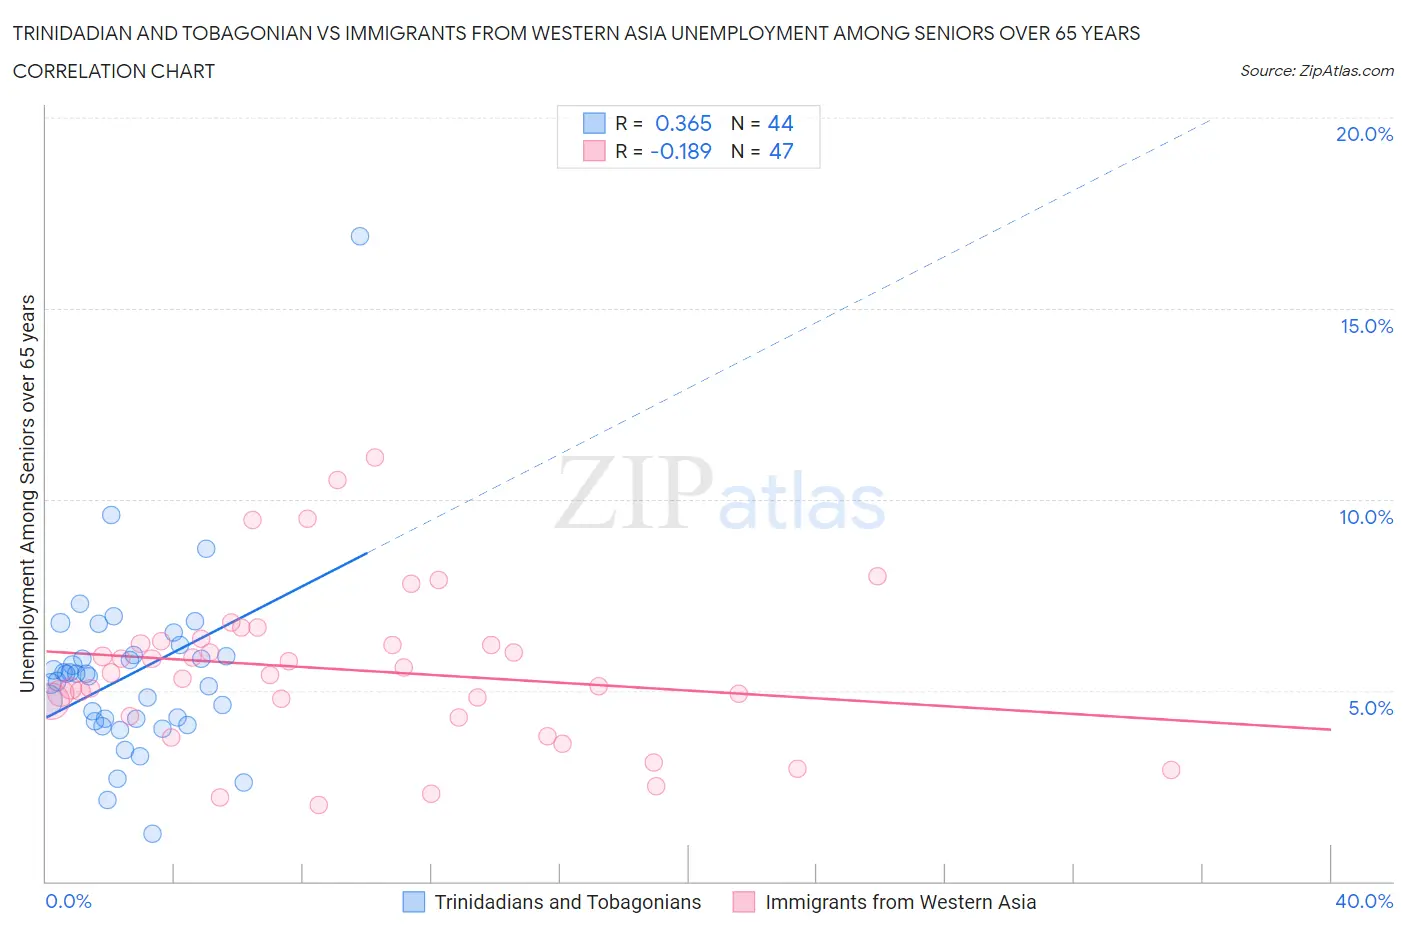
Trinidadian and Tobagonian vs Immigrants from Western Asia Unemployment Among Seniors over 65 years Correlation Chart
The statistical analysis conducted on geographies consisting of 207,503,082 people shows a mild positive correlation between the proportion of Trinidadians and Tobagonians and unemployment rate amomg seniors over the age of 65 in the United States with a correlation coefficient (R) of 0.365 and weighted average of 5.4%. Similarly, the statistical analysis conducted on geographies consisting of 367,995,026 people shows a poor negative correlation between the proportion of Immigrants from Western Asia and unemployment rate amomg seniors over the age of 65 in the United States with a correlation coefficient (R) of -0.189 and weighted average of 5.2%, a difference of 3.9%.
Unemployment Among Seniors over 65 years Correlation Summary
| Measurement | Trinidadian and Tobagonian | Immigrants from Western Asia |
| Minimum | 1.2% | 2.0% |
| Maximum | 16.9% | 11.1% |
| Range | 15.7% | 9.1% |
| Mean | 5.4% | 5.5% |
| Median | 5.4% | 5.5% |
| Interquartile 25% (IQ1) | 4.2% | 4.3% |
| Interquartile 75% (IQ3) | 5.9% | 6.3% |
| Interquartile Range (IQR) | 1.7% | 1.9% |
| Standard Deviation (Sample) | 2.4% | 2.0% |
| Standard Deviation (Population) | 2.3% | 2.0% |
Similar Demographics by Unemployment Among Seniors over 65 years
Demographics Similar to Trinidadians and Tobagonians by Unemployment Among Seniors over 65 years
In terms of unemployment among seniors over 65 years, the demographic groups most similar to Trinidadians and Tobagonians are Immigrants from Sierra Leone (5.4%, a difference of 0.030%), West Indian (5.4%, a difference of 0.070%), Immigrants (5.4%, a difference of 0.080%), Ghanaian (5.4%, a difference of 0.080%), and Paraguayan (5.4%, a difference of 0.090%).
| Demographics | Rating | Rank | Unemployment Among Seniors over 65 years |
| Ottawa | 0.8 /100 | #245 | Tragic 5.3% |
| Colombians | 0.7 /100 | #246 | Tragic 5.3% |
| Immigrants | Caribbean | 0.7 /100 | #247 | Tragic 5.3% |
| French Canadians | 0.7 /100 | #248 | Tragic 5.4% |
| Immigrants | Immigrants | 0.6 /100 | #249 | Tragic 5.4% |
| Ghanaians | 0.6 /100 | #250 | Tragic 5.4% |
| West Indians | 0.6 /100 | #251 | Tragic 5.4% |
| Trinidadians and Tobagonians | 0.6 /100 | #252 | Tragic 5.4% |
| Immigrants | Sierra Leone | 0.6 /100 | #253 | Tragic 5.4% |
| Paraguayans | 0.5 /100 | #254 | Tragic 5.4% |
| Immigrants | Peru | 0.5 /100 | #255 | Tragic 5.4% |
| Moroccans | 0.5 /100 | #256 | Tragic 5.4% |
| Immigrants | Micronesia | 0.4 /100 | #257 | Tragic 5.4% |
| Sierra Leoneans | 0.4 /100 | #258 | Tragic 5.4% |
| Immigrants | Ghana | 0.4 /100 | #259 | Tragic 5.4% |
Demographics Similar to Immigrants from Western Asia by Unemployment Among Seniors over 65 years
In terms of unemployment among seniors over 65 years, the demographic groups most similar to Immigrants from Western Asia are Immigrants from Serbia (5.2%, a difference of 0.020%), Panamanian (5.2%, a difference of 0.030%), Immigrants from Italy (5.2%, a difference of 0.040%), Russian (5.2%, a difference of 0.050%), and Immigrants from Somalia (5.2%, a difference of 0.060%).
| Demographics | Rating | Rank | Unemployment Among Seniors over 65 years |
| Indians (Asian) | 46.6 /100 | #176 | Average 5.2% |
| Icelanders | 45.9 /100 | #177 | Average 5.2% |
| Immigrants | Belgium | 44.8 /100 | #178 | Average 5.2% |
| Immigrants | Somalia | 44.0 /100 | #179 | Average 5.2% |
| Russians | 43.6 /100 | #180 | Average 5.2% |
| Immigrants | Italy | 43.5 /100 | #181 | Average 5.2% |
| Panamanians | 43.0 /100 | #182 | Average 5.2% |
| Immigrants | Western Asia | 42.1 /100 | #183 | Average 5.2% |
| Immigrants | Serbia | 41.6 /100 | #184 | Average 5.2% |
| Immigrants | Iran | 36.0 /100 | #185 | Fair 5.2% |
| Americans | 35.1 /100 | #186 | Fair 5.2% |
| Somalis | 33.5 /100 | #187 | Fair 5.2% |
| Immigrants | Egypt | 33.2 /100 | #188 | Fair 5.2% |
| Bangladeshis | 32.3 /100 | #189 | Fair 5.2% |
| Koreans | 31.6 /100 | #190 | Fair 5.2% |