Trinidadian and Tobagonian vs Immigrants from Western Asia 12th Grade, No Diploma
COMPARE
Trinidadian and Tobagonian
Immigrants from Western Asia
12th Grade, No Diploma
12th Grade, No Diploma Comparison
Trinidadians and Tobagonians
Immigrants from Western Asia
89.4%
12TH GRADE, NO DIPLOMA
0.2/ 100
METRIC RATING
265th/ 347
METRIC RANK
91.2%
12TH GRADE, NO DIPLOMA
49.0/ 100
METRIC RATING
175th/ 347
METRIC RANK
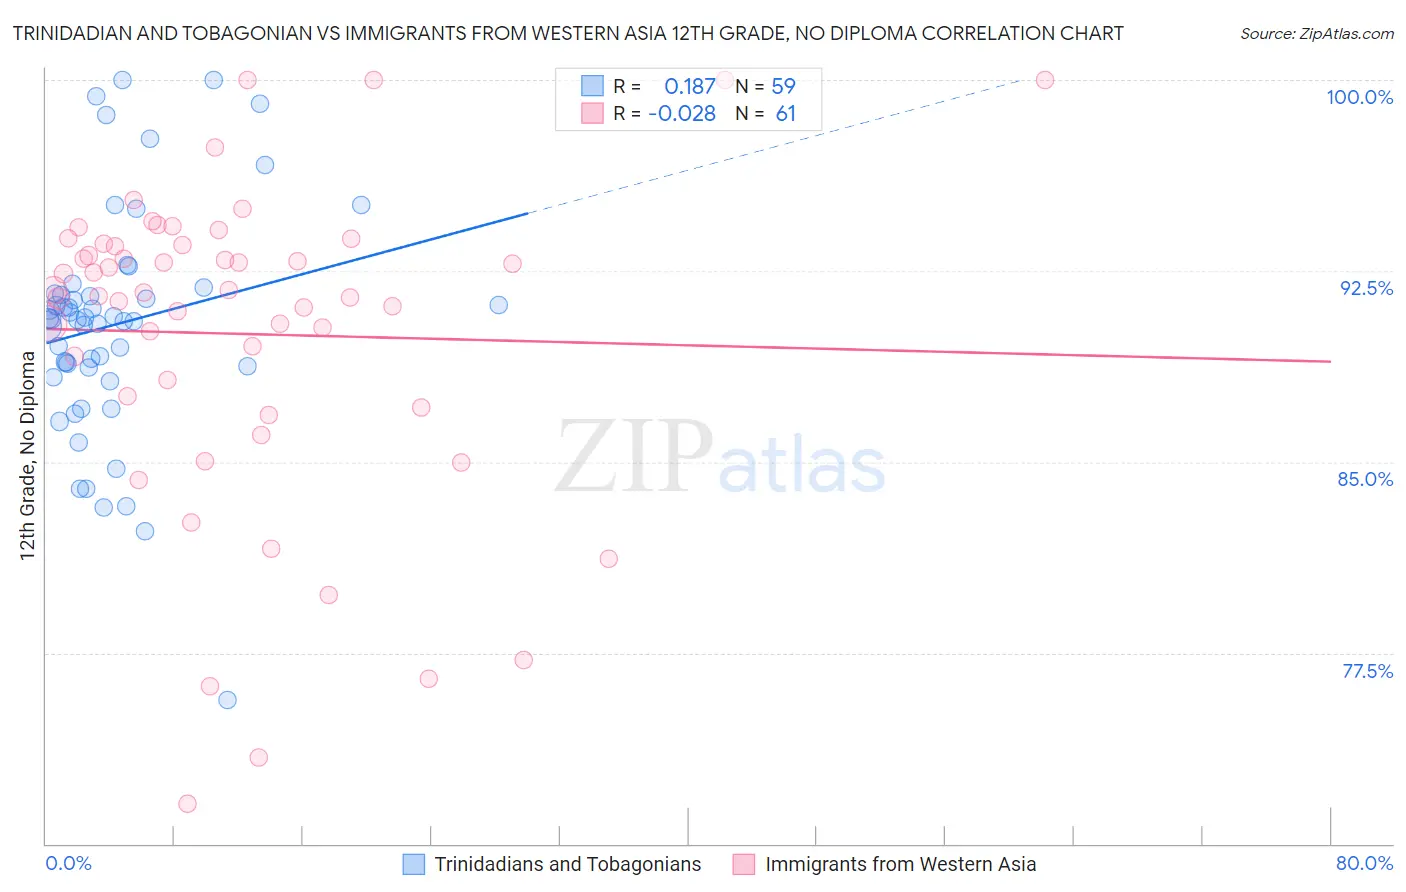
Trinidadian and Tobagonian vs Immigrants from Western Asia 12th Grade, No Diploma Correlation Chart
The statistical analysis conducted on geographies consisting of 219,881,800 people shows a poor positive correlation between the proportion of Trinidadians and Tobagonians and percentage of population with at least 12th grade (no diploma) education in the United States with a correlation coefficient (R) of 0.187 and weighted average of 89.4%. Similarly, the statistical analysis conducted on geographies consisting of 404,433,811 people shows no correlation between the proportion of Immigrants from Western Asia and percentage of population with at least 12th grade (no diploma) education in the United States with a correlation coefficient (R) of -0.028 and weighted average of 91.2%, a difference of 1.9%.
12th Grade, No Diploma Correlation Summary
| Measurement | Trinidadian and Tobagonian | Immigrants from Western Asia |
| Minimum | 75.6% | 71.6% |
| Maximum | 100.0% | 100.0% |
| Range | 24.4% | 28.4% |
| Mean | 90.4% | 90.0% |
| Median | 90.6% | 91.6% |
| Interquartile 25% (IQ1) | 88.7% | 87.4% |
| Interquartile 75% (IQ3) | 91.6% | 93.5% |
| Interquartile Range (IQR) | 2.9% | 6.2% |
| Standard Deviation (Sample) | 4.5% | 6.3% |
| Standard Deviation (Population) | 4.5% | 6.2% |
Similar Demographics by 12th Grade, No Diploma
Demographics Similar to Trinidadians and Tobagonians by 12th Grade, No Diploma
In terms of 12th grade, no diploma, the demographic groups most similar to Trinidadians and Tobagonians are Sri Lankan (89.4%, a difference of 0.010%), Immigrants from Jamaica (89.5%, a difference of 0.060%), Seminole (89.4%, a difference of 0.070%), West Indian (89.3%, a difference of 0.080%), and Immigrants from Trinidad and Tobago (89.3%, a difference of 0.10%).
| Demographics | Rating | Rank | 12th Grade, No Diploma |
| Africans | 0.4 /100 | #258 | Tragic 89.6% |
| Immigrants | Western Africa | 0.4 /100 | #259 | Tragic 89.6% |
| Immigrants | South Eastern Asia | 0.4 /100 | #260 | Tragic 89.6% |
| Cheyenne | 0.4 /100 | #261 | Tragic 89.6% |
| Sioux | 0.4 /100 | #262 | Tragic 89.6% |
| Immigrants | Jamaica | 0.2 /100 | #263 | Tragic 89.5% |
| Sri Lankans | 0.2 /100 | #264 | Tragic 89.4% |
| Trinidadians and Tobagonians | 0.2 /100 | #265 | Tragic 89.4% |
| Seminole | 0.2 /100 | #266 | Tragic 89.4% |
| West Indians | 0.2 /100 | #267 | Tragic 89.3% |
| Immigrants | Trinidad and Tobago | 0.1 /100 | #268 | Tragic 89.3% |
| U.S. Virgin Islanders | 0.1 /100 | #269 | Tragic 89.3% |
| Bangladeshis | 0.1 /100 | #270 | Tragic 89.3% |
| Blacks/African Americans | 0.1 /100 | #271 | Tragic 89.3% |
| Malaysians | 0.1 /100 | #272 | Tragic 89.2% |
Demographics Similar to Immigrants from Western Asia by 12th Grade, No Diploma
In terms of 12th grade, no diploma, the demographic groups most similar to Immigrants from Western Asia are Immigrants from Nepal (91.2%, a difference of 0.010%), Iroquois (91.1%, a difference of 0.010%), Bermudan (91.2%, a difference of 0.020%), Bolivian (91.2%, a difference of 0.020%), and Sierra Leonean (91.1%, a difference of 0.020%).
| Demographics | Rating | Rank | 12th Grade, No Diploma |
| Cree | 57.0 /100 | #168 | Average 91.2% |
| Immigrants | Indonesia | 54.9 /100 | #169 | Average 91.2% |
| Delaware | 52.8 /100 | #170 | Average 91.2% |
| Immigrants | Morocco | 51.4 /100 | #171 | Average 91.2% |
| Bermudans | 50.8 /100 | #172 | Average 91.2% |
| Bolivians | 50.4 /100 | #173 | Average 91.2% |
| Immigrants | Nepal | 50.0 /100 | #174 | Average 91.2% |
| Immigrants | Western Asia | 49.0 /100 | #175 | Average 91.2% |
| Iroquois | 48.5 /100 | #176 | Average 91.1% |
| Sierra Leoneans | 47.7 /100 | #177 | Average 91.1% |
| Spanish | 43.7 /100 | #178 | Average 91.1% |
| Immigrants | Chile | 43.3 /100 | #179 | Average 91.1% |
| Immigrants | Syria | 40.3 /100 | #180 | Average 91.1% |
| Guamanians/Chamorros | 39.5 /100 | #181 | Fair 91.0% |
| Immigrants | Nonimmigrants | 38.8 /100 | #182 | Fair 91.0% |