Swedish vs Kiowa Unemployment Among Ages 25 to 29 years
COMPARE
Swedish
Kiowa
Unemployment Among Ages 25 to 29 years
Unemployment Among Ages 25 to 29 years Comparison
Swedes
Kiowa
6.2%
UNEMPLOYMENT AMONG AGES 25 TO 29 YEARS
98.8/ 100
METRIC RATING
54th/ 347
METRIC RANK
7.4%
UNEMPLOYMENT AMONG AGES 25 TO 29 YEARS
0.1/ 100
METRIC RATING
263rd/ 347
METRIC RANK
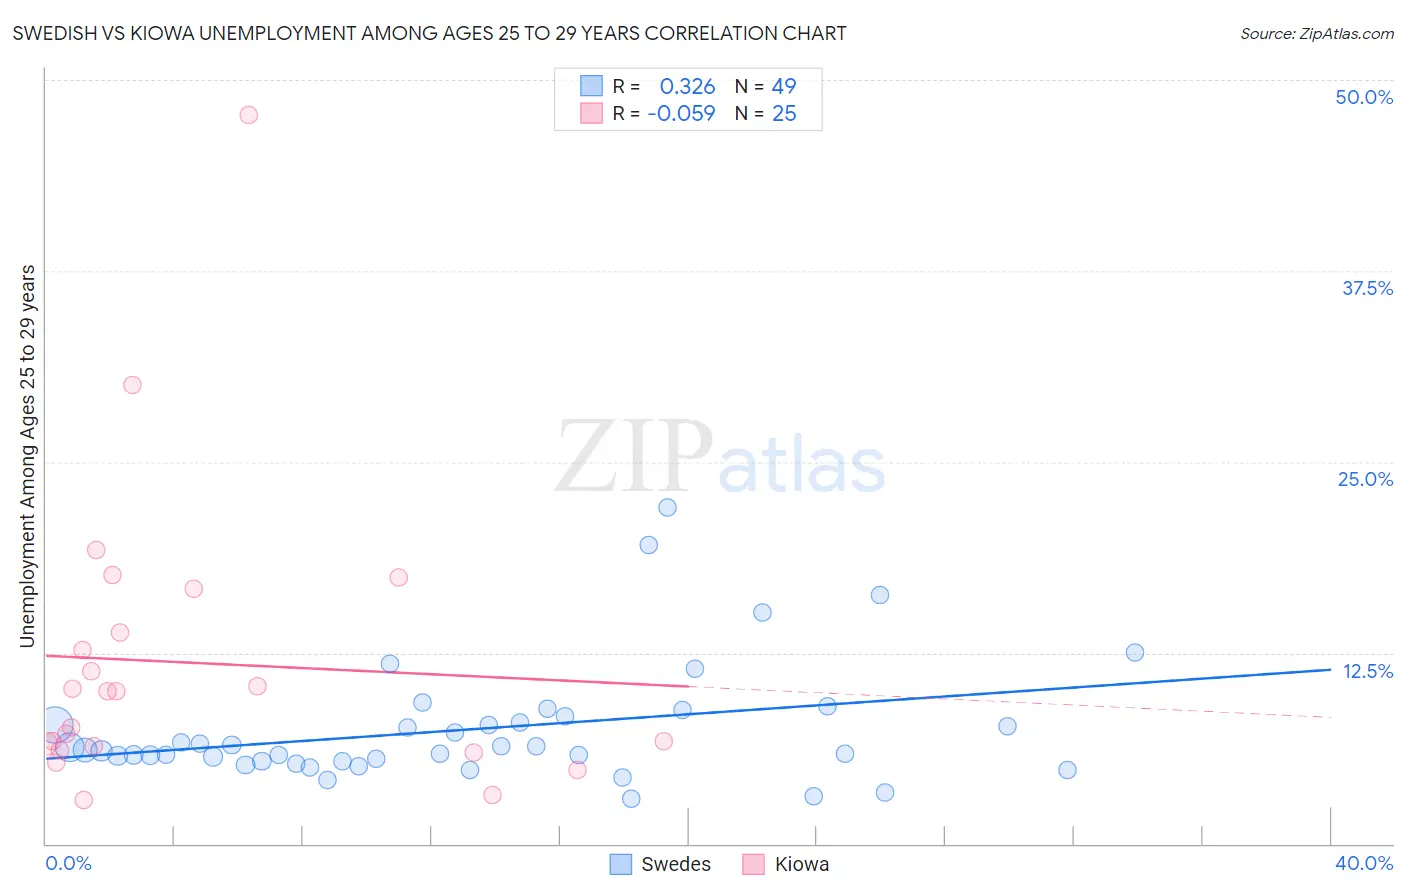
Swedish vs Kiowa Unemployment Among Ages 25 to 29 years Correlation Chart
The statistical analysis conducted on geographies consisting of 484,273,881 people shows a mild positive correlation between the proportion of Swedes and unemployment rate among population between the ages 25 and 29 in the United States with a correlation coefficient (R) of 0.326 and weighted average of 6.2%. Similarly, the statistical analysis conducted on geographies consisting of 55,447,690 people shows a slight negative correlation between the proportion of Kiowa and unemployment rate among population between the ages 25 and 29 in the United States with a correlation coefficient (R) of -0.059 and weighted average of 7.4%, a difference of 19.2%.
Unemployment Among Ages 25 to 29 years Correlation Summary
| Measurement | Swedish | Kiowa |
| Minimum | 3.0% | 2.9% |
| Maximum | 22.0% | 47.7% |
| Range | 19.1% | 44.8% |
| Mean | 7.5% | 11.9% |
| Median | 6.1% | 10.0% |
| Interquartile 25% (IQ1) | 5.4% | 6.3% |
| Interquartile 75% (IQ3) | 8.1% | 15.3% |
| Interquartile Range (IQR) | 2.7% | 9.0% |
| Standard Deviation (Sample) | 3.9% | 9.7% |
| Standard Deviation (Population) | 3.8% | 9.5% |
Similar Demographics by Unemployment Among Ages 25 to 29 years
Demographics Similar to Swedes by Unemployment Among Ages 25 to 29 years
In terms of unemployment among ages 25 to 29 years, the demographic groups most similar to Swedes are Turkish (6.2%, a difference of 0.020%), Immigrants from Turkey (6.2%, a difference of 0.080%), Burmese (6.2%, a difference of 0.12%), Soviet Union (6.2%, a difference of 0.16%), and Immigrants from Netherlands (6.2%, a difference of 0.18%).
| Demographics | Rating | Rank | Unemployment Among Ages 25 to 29 years |
| Latvians | 99.0 /100 | #47 | Exceptional 6.2% |
| Immigrants | Australia | 99.0 /100 | #48 | Exceptional 6.2% |
| German Russians | 99.0 /100 | #49 | Exceptional 6.2% |
| Soviet Union | 98.9 /100 | #50 | Exceptional 6.2% |
| Burmese | 98.9 /100 | #51 | Exceptional 6.2% |
| Immigrants | Turkey | 98.9 /100 | #52 | Exceptional 6.2% |
| Turks | 98.8 /100 | #53 | Exceptional 6.2% |
| Swedes | 98.8 /100 | #54 | Exceptional 6.2% |
| Immigrants | Netherlands | 98.7 /100 | #55 | Exceptional 6.2% |
| Immigrants | Burma/Myanmar | 98.7 /100 | #56 | Exceptional 6.2% |
| Immigrants | Saudi Arabia | 98.6 /100 | #57 | Exceptional 6.2% |
| Immigrants | Eastern Asia | 98.4 /100 | #58 | Exceptional 6.2% |
| Luxembourgers | 98.3 /100 | #59 | Exceptional 6.2% |
| Immigrants | Taiwan | 98.3 /100 | #60 | Exceptional 6.2% |
| Bhutanese | 98.2 /100 | #61 | Exceptional 6.2% |
Demographics Similar to Kiowa by Unemployment Among Ages 25 to 29 years
In terms of unemployment among ages 25 to 29 years, the demographic groups most similar to Kiowa are Ecuadorian (7.4%, a difference of 0.080%), Immigrants from Western Africa (7.4%, a difference of 0.090%), Nigerian (7.4%, a difference of 0.13%), Immigrants from Fiji (7.4%, a difference of 0.15%), and American (7.4%, a difference of 0.22%).
| Demographics | Rating | Rank | Unemployment Among Ages 25 to 29 years |
| Mexican American Indians | 0.3 /100 | #256 | Tragic 7.3% |
| Assyrians/Chaldeans/Syriacs | 0.2 /100 | #257 | Tragic 7.3% |
| Ottawa | 0.1 /100 | #258 | Tragic 7.3% |
| Cree | 0.1 /100 | #259 | Tragic 7.3% |
| Americans | 0.1 /100 | #260 | Tragic 7.4% |
| Nigerians | 0.1 /100 | #261 | Tragic 7.4% |
| Ecuadorians | 0.1 /100 | #262 | Tragic 7.4% |
| Kiowa | 0.1 /100 | #263 | Tragic 7.4% |
| Immigrants | Western Africa | 0.1 /100 | #264 | Tragic 7.4% |
| Immigrants | Fiji | 0.1 /100 | #265 | Tragic 7.4% |
| Paiute | 0.1 /100 | #266 | Tragic 7.4% |
| Pennsylvania Germans | 0.1 /100 | #267 | Tragic 7.4% |
| Immigrants | Ecuador | 0.1 /100 | #268 | Tragic 7.4% |
| Immigrants | Latin America | 0.1 /100 | #269 | Tragic 7.4% |
| Bahamians | 0.0 /100 | #270 | Tragic 7.5% |