Polish vs Kiowa Unemployment Among Ages 25 to 29 years
COMPARE
Polish
Kiowa
Unemployment Among Ages 25 to 29 years
Unemployment Among Ages 25 to 29 years Comparison
Poles
Kiowa
6.5%
UNEMPLOYMENT AMONG AGES 25 TO 29 YEARS
76.6/ 100
METRIC RATING
132nd/ 347
METRIC RANK
7.4%
UNEMPLOYMENT AMONG AGES 25 TO 29 YEARS
0.1/ 100
METRIC RATING
263rd/ 347
METRIC RANK
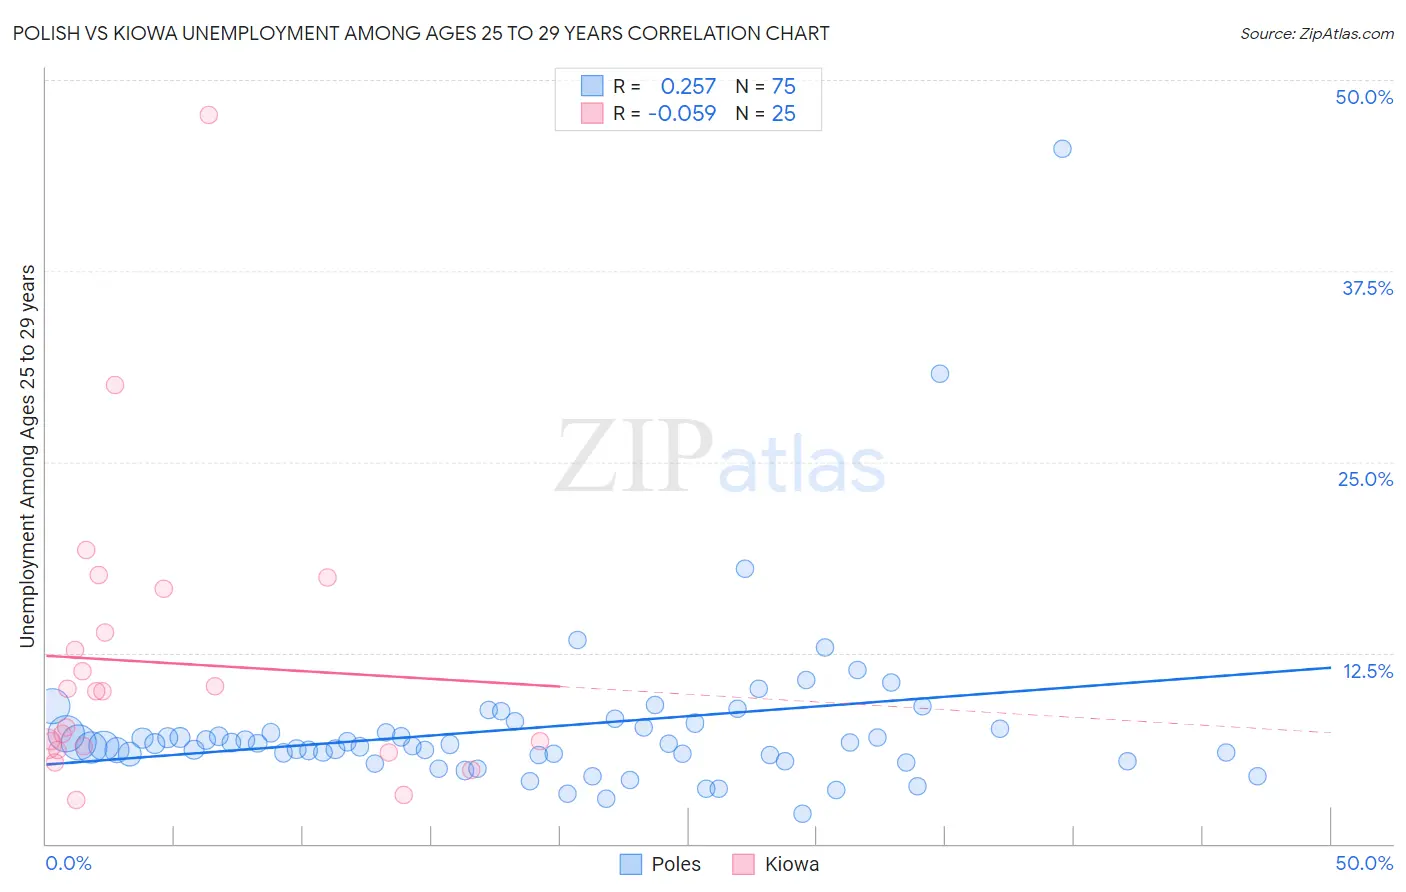
Polish vs Kiowa Unemployment Among Ages 25 to 29 years Correlation Chart
The statistical analysis conducted on geographies consisting of 499,723,936 people shows a weak positive correlation between the proportion of Poles and unemployment rate among population between the ages 25 and 29 in the United States with a correlation coefficient (R) of 0.257 and weighted average of 6.5%. Similarly, the statistical analysis conducted on geographies consisting of 55,447,690 people shows a slight negative correlation between the proportion of Kiowa and unemployment rate among population between the ages 25 and 29 in the United States with a correlation coefficient (R) of -0.059 and weighted average of 7.4%, a difference of 13.2%.
Unemployment Among Ages 25 to 29 years Correlation Summary
| Measurement | Polish | Kiowa |
| Minimum | 2.0% | 2.9% |
| Maximum | 45.5% | 47.7% |
| Range | 43.5% | 44.8% |
| Mean | 7.6% | 11.9% |
| Median | 6.5% | 10.0% |
| Interquartile 25% (IQ1) | 5.8% | 6.3% |
| Interquartile 75% (IQ3) | 7.6% | 15.3% |
| Interquartile Range (IQR) | 1.9% | 9.0% |
| Standard Deviation (Sample) | 5.8% | 9.7% |
| Standard Deviation (Population) | 5.7% | 9.5% |
Similar Demographics by Unemployment Among Ages 25 to 29 years
Demographics Similar to Poles by Unemployment Among Ages 25 to 29 years
In terms of unemployment among ages 25 to 29 years, the demographic groups most similar to Poles are Immigrants from Europe (6.5%, a difference of 0.080%), Immigrants from Vietnam (6.5%, a difference of 0.090%), Immigrants from Croatia (6.5%, a difference of 0.090%), Northern European (6.5%, a difference of 0.11%), and Eastern European (6.5%, a difference of 0.22%).
| Demographics | Rating | Rank | Unemployment Among Ages 25 to 29 years |
| Syrians | 82.1 /100 | #125 | Excellent 6.5% |
| Brazilians | 81.9 /100 | #126 | Excellent 6.5% |
| Dutch | 80.6 /100 | #127 | Excellent 6.5% |
| Immigrants | Chile | 80.5 /100 | #128 | Excellent 6.5% |
| Sri Lankans | 80.3 /100 | #129 | Excellent 6.5% |
| Immigrants | Peru | 79.9 /100 | #130 | Good 6.5% |
| Immigrants | Afghanistan | 79.2 /100 | #131 | Good 6.5% |
| Poles | 76.6 /100 | #132 | Good 6.5% |
| Immigrants | Europe | 75.7 /100 | #133 | Good 6.5% |
| Immigrants | Vietnam | 75.6 /100 | #134 | Good 6.5% |
| Immigrants | Croatia | 75.5 /100 | #135 | Good 6.5% |
| Northern Europeans | 75.4 /100 | #136 | Good 6.5% |
| Eastern Europeans | 74.1 /100 | #137 | Good 6.5% |
| Immigrants | Belgium | 73.8 /100 | #138 | Good 6.5% |
| Austrians | 73.8 /100 | #139 | Good 6.5% |
Demographics Similar to Kiowa by Unemployment Among Ages 25 to 29 years
In terms of unemployment among ages 25 to 29 years, the demographic groups most similar to Kiowa are Ecuadorian (7.4%, a difference of 0.080%), Immigrants from Western Africa (7.4%, a difference of 0.090%), Nigerian (7.4%, a difference of 0.13%), Immigrants from Fiji (7.4%, a difference of 0.15%), and American (7.4%, a difference of 0.22%).
| Demographics | Rating | Rank | Unemployment Among Ages 25 to 29 years |
| Mexican American Indians | 0.3 /100 | #256 | Tragic 7.3% |
| Assyrians/Chaldeans/Syriacs | 0.2 /100 | #257 | Tragic 7.3% |
| Ottawa | 0.1 /100 | #258 | Tragic 7.3% |
| Cree | 0.1 /100 | #259 | Tragic 7.3% |
| Americans | 0.1 /100 | #260 | Tragic 7.4% |
| Nigerians | 0.1 /100 | #261 | Tragic 7.4% |
| Ecuadorians | 0.1 /100 | #262 | Tragic 7.4% |
| Kiowa | 0.1 /100 | #263 | Tragic 7.4% |
| Immigrants | Western Africa | 0.1 /100 | #264 | Tragic 7.4% |
| Immigrants | Fiji | 0.1 /100 | #265 | Tragic 7.4% |
| Paiute | 0.1 /100 | #266 | Tragic 7.4% |
| Pennsylvania Germans | 0.1 /100 | #267 | Tragic 7.4% |
| Immigrants | Ecuador | 0.1 /100 | #268 | Tragic 7.4% |
| Immigrants | Latin America | 0.1 /100 | #269 | Tragic 7.4% |
| Bahamians | 0.0 /100 | #270 | Tragic 7.5% |