Swedish vs Immigrants from Uganda Unemployment Among Ages 20 to 24 years
COMPARE
Swedish
Immigrants from Uganda
Unemployment Among Ages 20 to 24 years
Unemployment Among Ages 20 to 24 years Comparison
Swedes
Immigrants from Uganda
9.5%
UNEMPLOYMENT AMONG AGES 20 TO 24 YEARS
100.0/ 100
METRIC RATING
26th/ 347
METRIC RANK
10.2%
UNEMPLOYMENT AMONG AGES 20 TO 24 YEARS
65.6/ 100
METRIC RATING
157th/ 347
METRIC RANK
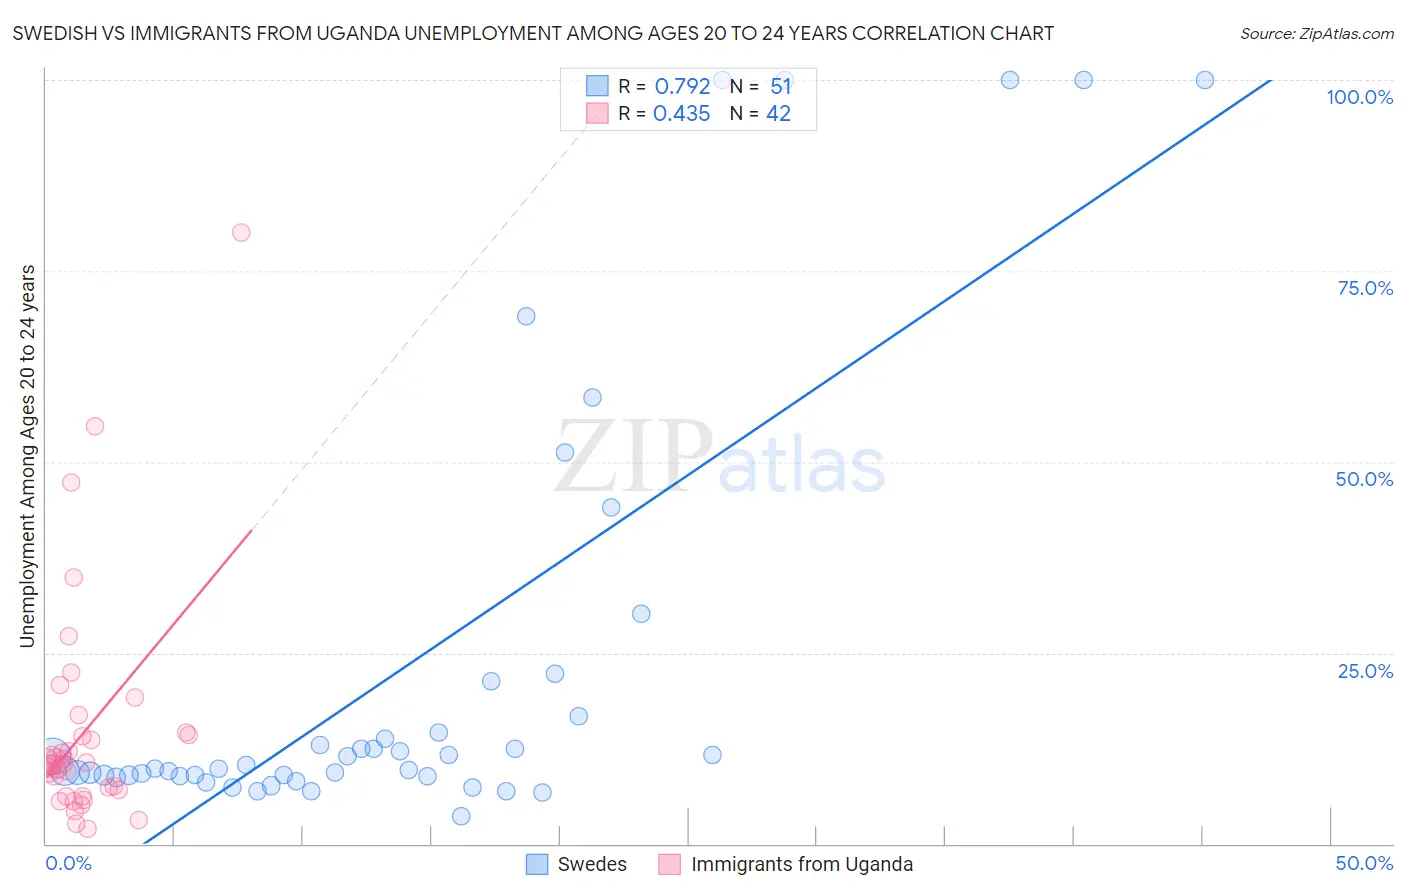
Swedish vs Immigrants from Uganda Unemployment Among Ages 20 to 24 years Correlation Chart
The statistical analysis conducted on geographies consisting of 499,126,762 people shows a strong positive correlation between the proportion of Swedes and unemployment rate among population between the ages 20 and 24 in the United States with a correlation coefficient (R) of 0.792 and weighted average of 9.5%. Similarly, the statistical analysis conducted on geographies consisting of 125,231,495 people shows a moderate positive correlation between the proportion of Immigrants from Uganda and unemployment rate among population between the ages 20 and 24 in the United States with a correlation coefficient (R) of 0.435 and weighted average of 10.2%, a difference of 8.3%.
Unemployment Among Ages 20 to 24 years Correlation Summary
| Measurement | Swedish | Immigrants from Uganda |
| Minimum | 3.6% | 2.0% |
| Maximum | 100.0% | 80.0% |
| Range | 96.4% | 78.0% |
| Mean | 23.1% | 14.7% |
| Median | 9.8% | 10.5% |
| Interquartile 25% (IQ1) | 8.9% | 7.0% |
| Interquartile 75% (IQ3) | 16.7% | 14.3% |
| Interquartile Range (IQR) | 7.8% | 7.3% |
| Standard Deviation (Sample) | 28.8% | 14.9% |
| Standard Deviation (Population) | 28.5% | 14.7% |
Similar Demographics by Unemployment Among Ages 20 to 24 years
Demographics Similar to Swedes by Unemployment Among Ages 20 to 24 years
In terms of unemployment among ages 20 to 24 years, the demographic groups most similar to Swedes are Immigrants from Eritrea (9.5%, a difference of 0.0%), Taiwanese (9.4%, a difference of 0.25%), Tongan (9.4%, a difference of 0.56%), Immigrants from Nepal (9.4%, a difference of 0.56%), and Immigrants from Zimbabwe (9.5%, a difference of 0.61%).
| Demographics | Rating | Rank | Unemployment Among Ages 20 to 24 years |
| Hmong | 100.0 /100 | #19 | Exceptional 9.4% |
| Osage | 100.0 /100 | #20 | Exceptional 9.4% |
| Immigrants | Bosnia and Herzegovina | 100.0 /100 | #21 | Exceptional 9.4% |
| Tongans | 100.0 /100 | #22 | Exceptional 9.4% |
| Immigrants | Nepal | 100.0 /100 | #23 | Exceptional 9.4% |
| Taiwanese | 100.0 /100 | #24 | Exceptional 9.4% |
| Immigrants | Eritrea | 100.0 /100 | #25 | Exceptional 9.5% |
| Swedes | 100.0 /100 | #26 | Exceptional 9.5% |
| Immigrants | Zimbabwe | 100.0 /100 | #27 | Exceptional 9.5% |
| Immigrants | Afghanistan | 100.0 /100 | #28 | Exceptional 9.5% |
| Immigrants | North Macedonia | 100.0 /100 | #29 | Exceptional 9.5% |
| Scandinavians | 100.0 /100 | #30 | Exceptional 9.5% |
| Immigrants | Eastern Africa | 100.0 /100 | #31 | Exceptional 9.5% |
| Cambodians | 100.0 /100 | #32 | Exceptional 9.5% |
| Australians | 100.0 /100 | #33 | Exceptional 9.6% |
Demographics Similar to Immigrants from Uganda by Unemployment Among Ages 20 to 24 years
In terms of unemployment among ages 20 to 24 years, the demographic groups most similar to Immigrants from Uganda are Immigrants from Kazakhstan (10.2%, a difference of 0.010%), Canadian (10.2%, a difference of 0.040%), Immigrants from England (10.3%, a difference of 0.080%), Spaniard (10.3%, a difference of 0.090%), and Indian (Asian) (10.3%, a difference of 0.12%).
| Demographics | Rating | Rank | Unemployment Among Ages 20 to 24 years |
| Hungarians | 74.4 /100 | #150 | Good 10.2% |
| Immigrants | South Africa | 73.6 /100 | #151 | Good 10.2% |
| Iranians | 72.4 /100 | #152 | Good 10.2% |
| Immigrants | Taiwan | 71.4 /100 | #153 | Good 10.2% |
| Immigrants | Switzerland | 71.3 /100 | #154 | Good 10.2% |
| Lithuanians | 70.0 /100 | #155 | Good 10.2% |
| Canadians | 66.7 /100 | #156 | Good 10.2% |
| Immigrants | Uganda | 65.6 /100 | #157 | Good 10.2% |
| Immigrants | Kazakhstan | 65.5 /100 | #158 | Good 10.2% |
| Immigrants | England | 63.7 /100 | #159 | Good 10.3% |
| Spaniards | 63.4 /100 | #160 | Good 10.3% |
| Indians (Asian) | 62.6 /100 | #161 | Good 10.3% |
| Immigrants | Asia | 61.3 /100 | #162 | Good 10.3% |
| Estonians | 61.1 /100 | #163 | Good 10.3% |
| Immigrants | Korea | 59.0 /100 | #164 | Average 10.3% |