Spanish vs Yakama Unemployment Among Women with Children Under 6 years
COMPARE
Spanish
Yakama
Unemployment Among Women with Children Under 6 years
Unemployment Among Women with Children Under 6 years Comparison
Spanish
Yakama
7.9%
UNEMPLOYMENT AMONG WOMEN WITH CHILDREN UNDER 6 YEARS
11.3/ 100
METRIC RATING
214th/ 347
METRIC RANK
6.6%
UNEMPLOYMENT AMONG WOMEN WITH CHILDREN UNDER 6 YEARS
100.0/ 100
METRIC RATING
35th/ 347
METRIC RANK
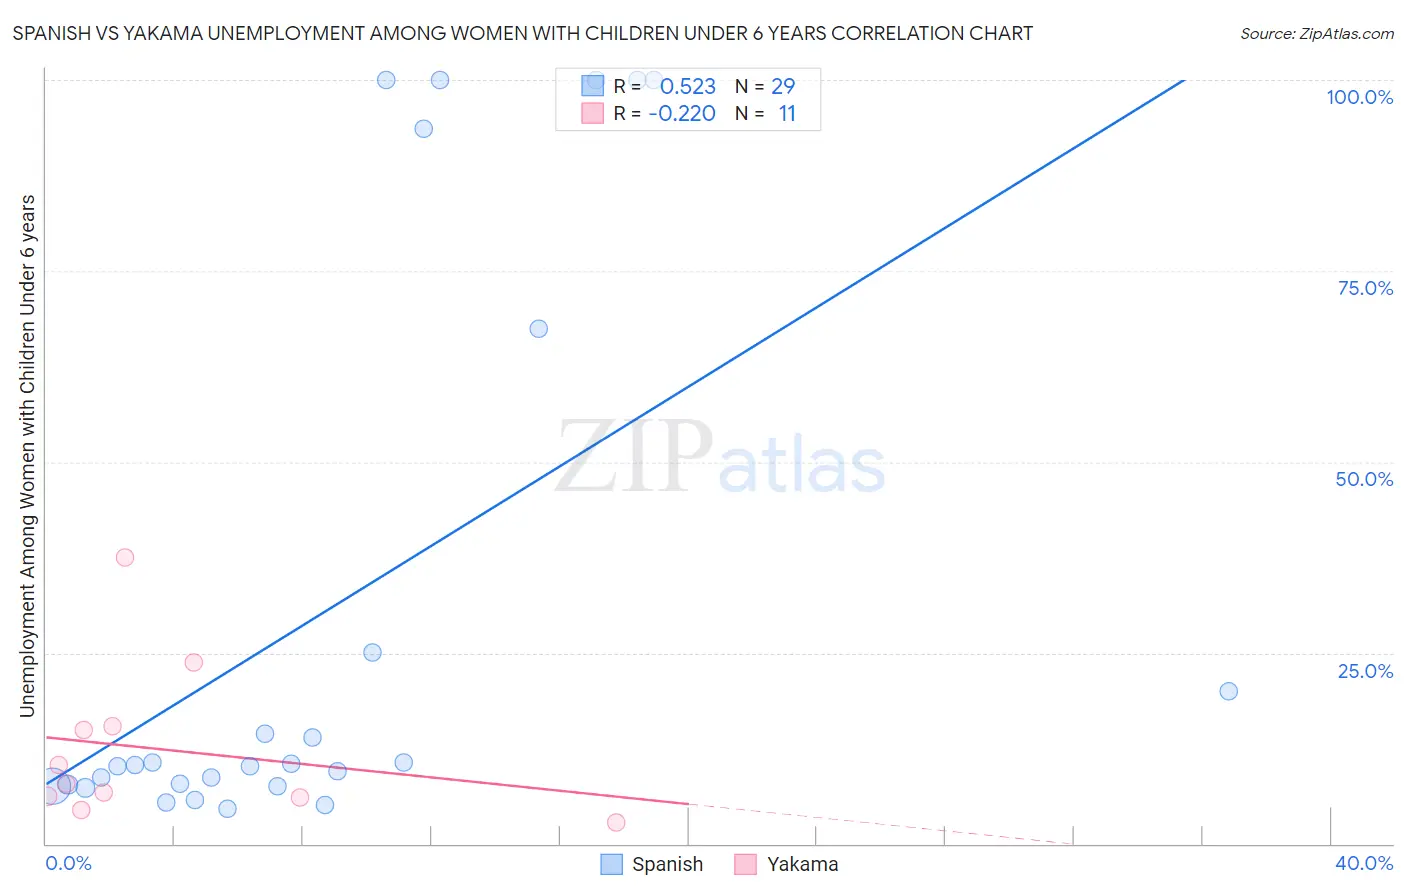
Spanish vs Yakama Unemployment Among Women with Children Under 6 years Correlation Chart
The statistical analysis conducted on geographies consisting of 316,873,283 people shows a substantial positive correlation between the proportion of Spanish and unemployment rate among women with children under the age of 6 in the United States with a correlation coefficient (R) of 0.523 and weighted average of 7.9%. Similarly, the statistical analysis conducted on geographies consisting of 17,322,416 people shows a weak negative correlation between the proportion of Yakama and unemployment rate among women with children under the age of 6 in the United States with a correlation coefficient (R) of -0.220 and weighted average of 6.6%, a difference of 19.3%.
Unemployment Among Women with Children Under 6 years Correlation Summary
| Measurement | Spanish | Yakama |
| Minimum | 4.6% | 2.8% |
| Maximum | 100.0% | 37.5% |
| Range | 95.4% | 34.7% |
| Mean | 30.4% | 12.3% |
| Median | 10.3% | 7.9% |
| Interquartile 25% (IQ1) | 7.6% | 6.0% |
| Interquartile 75% (IQ3) | 46.3% | 15.4% |
| Interquartile Range (IQR) | 38.6% | 9.4% |
| Standard Deviation (Sample) | 37.4% | 10.3% |
| Standard Deviation (Population) | 36.8% | 9.8% |
Similar Demographics by Unemployment Among Women with Children Under 6 years
Demographics Similar to Spanish by Unemployment Among Women with Children Under 6 years
In terms of unemployment among women with children under 6 years, the demographic groups most similar to Spanish are Ecuadorian (7.9%, a difference of 0.010%), Scottish (7.9%, a difference of 0.020%), Immigrants from Lebanon (7.9%, a difference of 0.030%), Immigrants from Nigeria (7.9%, a difference of 0.15%), and Swiss (7.9%, a difference of 0.16%).
| Demographics | Rating | Rank | Unemployment Among Women with Children Under 6 years |
| Canadians | 20.6 /100 | #207 | Fair 7.8% |
| Immigrants | Syria | 18.9 /100 | #208 | Poor 7.8% |
| Costa Ricans | 17.6 /100 | #209 | Poor 7.8% |
| Poles | 16.0 /100 | #210 | Poor 7.9% |
| Immigrants | Ecuador | 14.9 /100 | #211 | Poor 7.9% |
| Swiss | 12.3 /100 | #212 | Poor 7.9% |
| Scottish | 11.4 /100 | #213 | Poor 7.9% |
| Spanish | 11.3 /100 | #214 | Poor 7.9% |
| Ecuadorians | 11.2 /100 | #215 | Poor 7.9% |
| Immigrants | Lebanon | 11.1 /100 | #216 | Poor 7.9% |
| Immigrants | Nigeria | 10.3 /100 | #217 | Poor 7.9% |
| Moroccans | 9.7 /100 | #218 | Tragic 7.9% |
| Arabs | 9.4 /100 | #219 | Tragic 7.9% |
| South American Indians | 9.3 /100 | #220 | Tragic 7.9% |
| Immigrants | Germany | 8.5 /100 | #221 | Tragic 7.9% |
Demographics Similar to Yakama by Unemployment Among Women with Children Under 6 years
In terms of unemployment among women with children under 6 years, the demographic groups most similar to Yakama are Luxembourger (6.6%, a difference of 0.070%), Immigrants from South Central Asia (6.6%, a difference of 0.27%), Immigrants from Vietnam (6.6%, a difference of 0.28%), Tsimshian (6.6%, a difference of 0.30%), and Sri Lankan (6.6%, a difference of 0.32%).
| Demographics | Rating | Rank | Unemployment Among Women with Children Under 6 years |
| Immigrants | Israel | 100.0 /100 | #28 | Exceptional 6.5% |
| Immigrants | Sweden | 100.0 /100 | #29 | Exceptional 6.6% |
| Immigrants | Belarus | 100.0 /100 | #30 | Exceptional 6.6% |
| Immigrants | Moldova | 100.0 /100 | #31 | Exceptional 6.6% |
| Tsimshian | 100.0 /100 | #32 | Exceptional 6.6% |
| Immigrants | Vietnam | 100.0 /100 | #33 | Exceptional 6.6% |
| Immigrants | South Central Asia | 100.0 /100 | #34 | Exceptional 6.6% |
| Yakama | 100.0 /100 | #35 | Exceptional 6.6% |
| Luxembourgers | 100.0 /100 | #36 | Exceptional 6.6% |
| Sri Lankans | 100.0 /100 | #37 | Exceptional 6.6% |
| Hmong | 100.0 /100 | #38 | Exceptional 6.7% |
| Immigrants | Russia | 100.0 /100 | #39 | Exceptional 6.7% |
| Asians | 100.0 /100 | #40 | Exceptional 6.7% |
| Immigrants | Indonesia | 99.9 /100 | #41 | Exceptional 6.7% |
| Immigrants | Cuba | 99.9 /100 | #42 | Exceptional 6.7% |