Spanish vs Immigrants from Trinidad and Tobago Unemployment Among Women with Children Under 6 years
COMPARE
Spanish
Immigrants from Trinidad and Tobago
Unemployment Among Women with Children Under 6 years
Unemployment Among Women with Children Under 6 years Comparison
Spanish
Immigrants from Trinidad and Tobago
7.9%
UNEMPLOYMENT AMONG WOMEN WITH CHILDREN UNDER 6 YEARS
11.3/ 100
METRIC RATING
214th/ 347
METRIC RANK
8.0%
UNEMPLOYMENT AMONG WOMEN WITH CHILDREN UNDER 6 YEARS
4.8/ 100
METRIC RATING
233rd/ 347
METRIC RANK
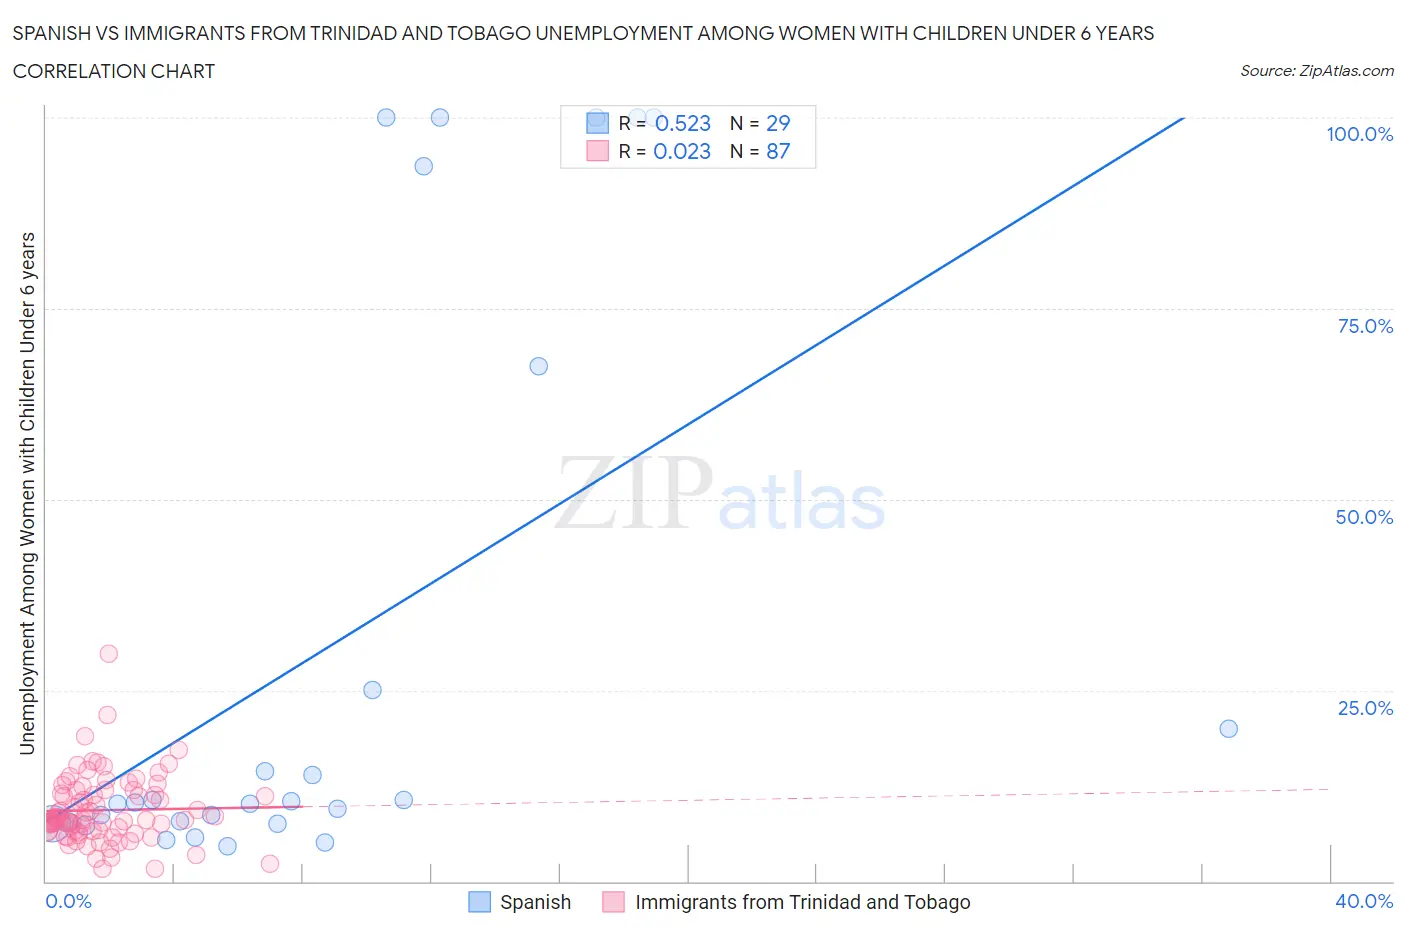
Spanish vs Immigrants from Trinidad and Tobago Unemployment Among Women with Children Under 6 years Correlation Chart
The statistical analysis conducted on geographies consisting of 316,873,283 people shows a substantial positive correlation between the proportion of Spanish and unemployment rate among women with children under the age of 6 in the United States with a correlation coefficient (R) of 0.523 and weighted average of 7.9%. Similarly, the statistical analysis conducted on geographies consisting of 187,913,923 people shows no correlation between the proportion of Immigrants from Trinidad and Tobago and unemployment rate among women with children under the age of 6 in the United States with a correlation coefficient (R) of 0.023 and weighted average of 8.0%, a difference of 1.5%.
Unemployment Among Women with Children Under 6 years Correlation Summary
| Measurement | Spanish | Immigrants from Trinidad and Tobago |
| Minimum | 4.6% | 1.6% |
| Maximum | 100.0% | 29.8% |
| Range | 95.4% | 28.2% |
| Mean | 30.4% | 9.3% |
| Median | 10.3% | 8.1% |
| Interquartile 25% (IQ1) | 7.6% | 6.7% |
| Interquartile 75% (IQ3) | 46.3% | 11.9% |
| Interquartile Range (IQR) | 38.6% | 5.2% |
| Standard Deviation (Sample) | 37.4% | 4.5% |
| Standard Deviation (Population) | 36.8% | 4.4% |
Demographics Similar to Spanish and Immigrants from Trinidad and Tobago by Unemployment Among Women with Children Under 6 years
In terms of unemployment among women with children under 6 years, the demographic groups most similar to Spanish are Ecuadorian (7.9%, a difference of 0.010%), Scottish (7.9%, a difference of 0.020%), Immigrants from Lebanon (7.9%, a difference of 0.030%), Immigrants from Nigeria (7.9%, a difference of 0.15%), and Moroccan (7.9%, a difference of 0.26%). Similarly, the demographic groups most similar to Immigrants from Trinidad and Tobago are Welsh (8.0%, a difference of 0.090%), Trinidadian and Tobagonian (8.0%, a difference of 0.17%), Finnish (8.0%, a difference of 0.18%), Salvadoran (8.0%, a difference of 0.25%), and Immigrants from Sudan (8.0%, a difference of 0.40%).
| Demographics | Rating | Rank | Unemployment Among Women with Children Under 6 years |
| Scottish | 11.4 /100 | #213 | Poor 7.9% |
| Spanish | 11.3 /100 | #214 | Poor 7.9% |
| Ecuadorians | 11.2 /100 | #215 | Poor 7.9% |
| Immigrants | Lebanon | 11.1 /100 | #216 | Poor 7.9% |
| Immigrants | Nigeria | 10.3 /100 | #217 | Poor 7.9% |
| Moroccans | 9.7 /100 | #218 | Tragic 7.9% |
| Arabs | 9.4 /100 | #219 | Tragic 7.9% |
| South American Indians | 9.3 /100 | #220 | Tragic 7.9% |
| Immigrants | Germany | 8.5 /100 | #221 | Tragic 7.9% |
| Samoans | 8.4 /100 | #222 | Tragic 7.9% |
| Carpatho Rusyns | 7.8 /100 | #223 | Tragic 8.0% |
| English | 7.2 /100 | #224 | Tragic 8.0% |
| Germans | 7.0 /100 | #225 | Tragic 8.0% |
| Senegalese | 6.2 /100 | #226 | Tragic 8.0% |
| Portuguese | 6.2 /100 | #227 | Tragic 8.0% |
| Immigrants | Sudan | 6.0 /100 | #228 | Tragic 8.0% |
| Salvadorans | 5.5 /100 | #229 | Tragic 8.0% |
| Finns | 5.3 /100 | #230 | Tragic 8.0% |
| Trinidadians and Tobagonians | 5.3 /100 | #231 | Tragic 8.0% |
| Welsh | 5.0 /100 | #232 | Tragic 8.0% |
| Immigrants | Trinidad and Tobago | 4.8 /100 | #233 | Tragic 8.0% |