Spanish vs Creek Unemployment Among Women with Children Under 18 years
COMPARE
Spanish
Creek
Unemployment Among Women with Children Under 18 years
Unemployment Among Women with Children Under 18 years Comparison
Spanish
Creek
5.4%
UNEMPLOYMENT AMONG WOMEN WITH CHILDREN UNDER 18 YEARS
49.0/ 100
METRIC RATING
175th/ 347
METRIC RANK
5.8%
UNEMPLOYMENT AMONG WOMEN WITH CHILDREN UNDER 18 YEARS
3.1/ 100
METRIC RATING
232nd/ 347
METRIC RANK
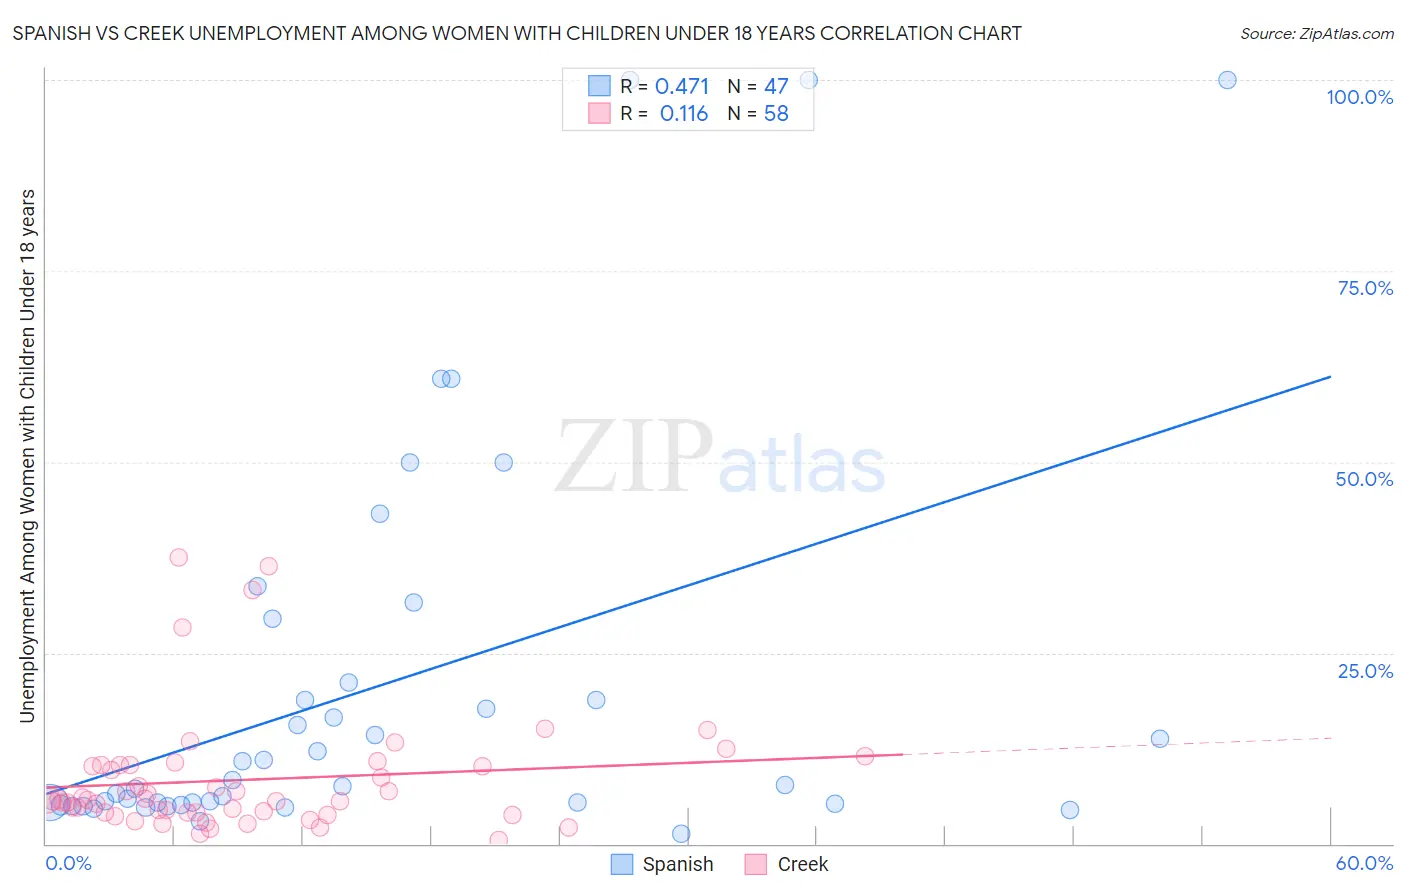
Spanish vs Creek Unemployment Among Women with Children Under 18 years Correlation Chart
The statistical analysis conducted on geographies consisting of 403,353,700 people shows a moderate positive correlation between the proportion of Spanish and unemployment rate among women with children under the age of 18 in the United States with a correlation coefficient (R) of 0.471 and weighted average of 5.4%. Similarly, the statistical analysis conducted on geographies consisting of 174,176,310 people shows a poor positive correlation between the proportion of Creek and unemployment rate among women with children under the age of 18 in the United States with a correlation coefficient (R) of 0.116 and weighted average of 5.8%, a difference of 6.0%.
Unemployment Among Women with Children Under 18 years Correlation Summary
| Measurement | Spanish | Creek |
| Minimum | 1.4% | 0.50% |
| Maximum | 100.0% | 37.5% |
| Range | 98.6% | 37.0% |
| Mean | 20.5% | 8.4% |
| Median | 7.7% | 5.7% |
| Interquartile 25% (IQ1) | 5.2% | 4.1% |
| Interquartile 75% (IQ3) | 21.2% | 10.3% |
| Interquartile Range (IQR) | 16.0% | 6.2% |
| Standard Deviation (Sample) | 26.0% | 7.9% |
| Standard Deviation (Population) | 25.7% | 7.8% |
Similar Demographics by Unemployment Among Women with Children Under 18 years
Demographics Similar to Spanish by Unemployment Among Women with Children Under 18 years
In terms of unemployment among women with children under 18 years, the demographic groups most similar to Spanish are Immigrants from Germany (5.5%, a difference of 0.040%), Immigrants from Uzbekistan (5.4%, a difference of 0.070%), Immigrants from Eastern Africa (5.4%, a difference of 0.16%), Immigrants from Kazakhstan (5.4%, a difference of 0.19%), and Hawaiian (5.5%, a difference of 0.21%).
| Demographics | Rating | Rank | Unemployment Among Women with Children Under 18 years |
| Immigrants | Northern Africa | 56.1 /100 | #168 | Average 5.4% |
| Immigrants | Thailand | 55.3 /100 | #169 | Average 5.4% |
| Samoans | 54.1 /100 | #170 | Average 5.4% |
| Immigrants | Philippines | 53.1 /100 | #171 | Average 5.4% |
| Immigrants | Kazakhstan | 51.7 /100 | #172 | Average 5.4% |
| Immigrants | Eastern Africa | 51.3 /100 | #173 | Average 5.4% |
| Immigrants | Uzbekistan | 50.0 /100 | #174 | Average 5.4% |
| Spanish | 49.0 /100 | #175 | Average 5.4% |
| Immigrants | Germany | 48.5 /100 | #176 | Average 5.5% |
| Hawaiians | 46.1 /100 | #177 | Average 5.5% |
| Costa Ricans | 45.2 /100 | #178 | Average 5.5% |
| Syrians | 42.8 /100 | #179 | Average 5.5% |
| Immigrants | Southern Europe | 42.7 /100 | #180 | Average 5.5% |
| Immigrants | Hungary | 41.3 /100 | #181 | Average 5.5% |
| Immigrants | Sudan | 40.6 /100 | #182 | Average 5.5% |
Demographics Similar to Creek by Unemployment Among Women with Children Under 18 years
In terms of unemployment among women with children under 18 years, the demographic groups most similar to Creek are Spanish American (5.8%, a difference of 0.020%), Immigrants from Africa (5.8%, a difference of 0.030%), Immigrants from South America (5.8%, a difference of 0.090%), Guamanian/Chamorro (5.8%, a difference of 0.13%), and Immigrants from Panama (5.8%, a difference of 0.15%).
| Demographics | Rating | Rank | Unemployment Among Women with Children Under 18 years |
| Armenians | 4.5 /100 | #225 | Tragic 5.7% |
| Cherokee | 4.3 /100 | #226 | Tragic 5.7% |
| Sierra Leoneans | 3.8 /100 | #227 | Tragic 5.8% |
| Somalis | 3.5 /100 | #228 | Tragic 5.8% |
| Immigrants | Panama | 3.4 /100 | #229 | Tragic 5.8% |
| Immigrants | South America | 3.2 /100 | #230 | Tragic 5.8% |
| Immigrants | Africa | 3.1 /100 | #231 | Tragic 5.8% |
| Creek | 3.1 /100 | #232 | Tragic 5.8% |
| Spanish Americans | 3.1 /100 | #233 | Tragic 5.8% |
| Guamanians/Chamorros | 2.9 /100 | #234 | Tragic 5.8% |
| Immigrants | Middle Africa | 2.8 /100 | #235 | Tragic 5.8% |
| Alsatians | 2.5 /100 | #236 | Tragic 5.8% |
| Immigrants | Lebanon | 2.4 /100 | #237 | Tragic 5.8% |
| Immigrants | Somalia | 2.2 /100 | #238 | Tragic 5.8% |
| Immigrants | Sierra Leone | 2.0 /100 | #239 | Tragic 5.8% |