Spanish American vs Immigrants from Liberia Unemployment
COMPARE
Spanish American
Immigrants from Liberia
Unemployment
Unemployment Comparison
Spanish Americans
Immigrants from Liberia
5.6%
UNEMPLOYMENT
2.0/ 100
METRIC RATING
242nd/ 347
METRIC RANK
5.8%
UNEMPLOYMENT
0.1/ 100
METRIC RATING
264th/ 347
METRIC RANK
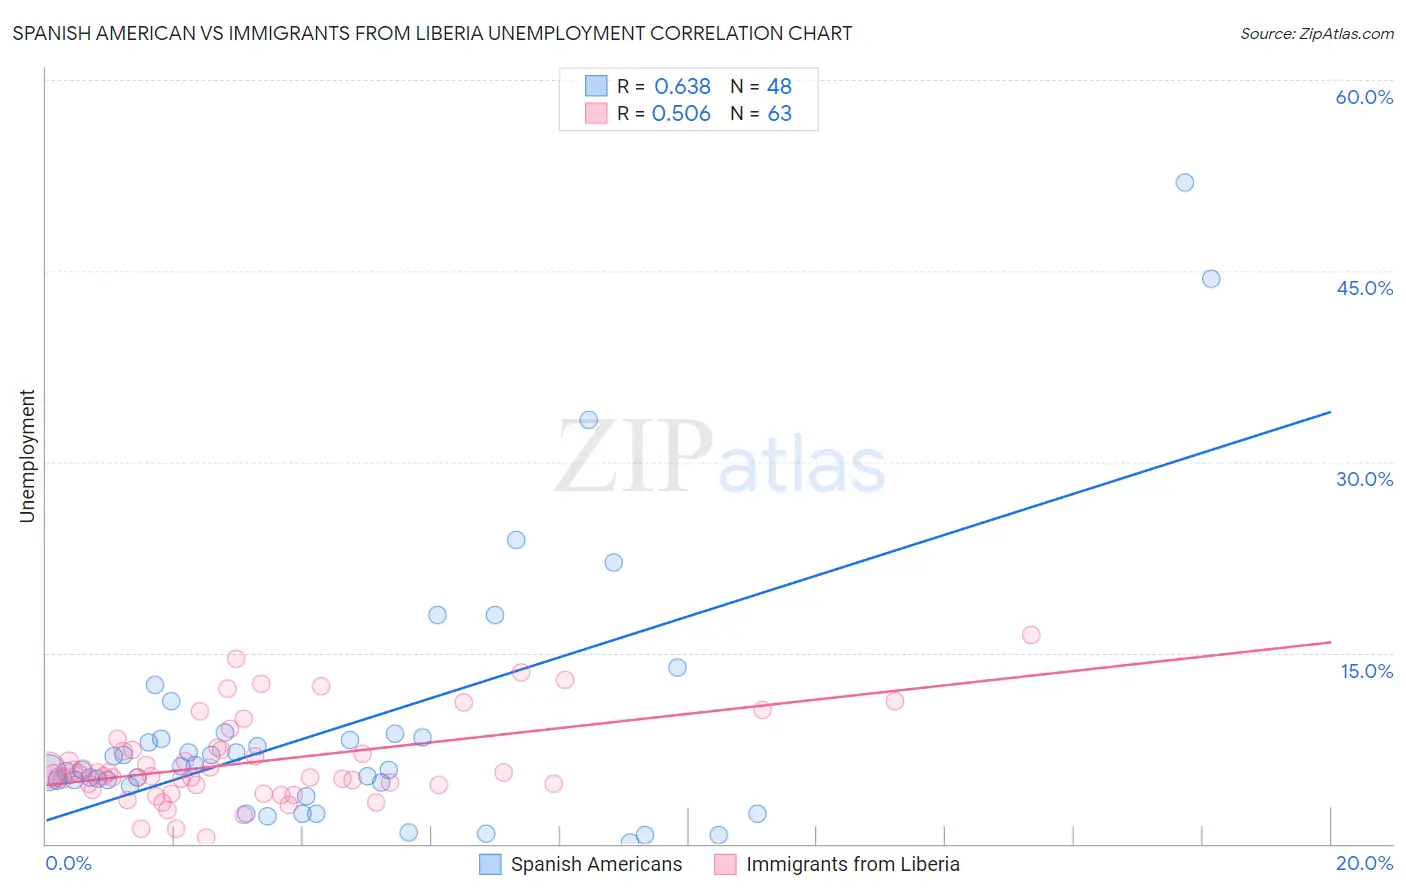
Spanish American vs Immigrants from Liberia Unemployment Correlation Chart
The statistical analysis conducted on geographies consisting of 103,137,220 people shows a significant positive correlation between the proportion of Spanish Americans and unemployment in the United States with a correlation coefficient (R) of 0.638 and weighted average of 5.6%. Similarly, the statistical analysis conducted on geographies consisting of 135,254,533 people shows a substantial positive correlation between the proportion of Immigrants from Liberia and unemployment in the United States with a correlation coefficient (R) of 0.506 and weighted average of 5.8%, a difference of 4.3%.
Unemployment Correlation Summary
| Measurement | Spanish American | Immigrants from Liberia |
| Minimum | 0.10% | 0.50% |
| Maximum | 51.9% | 16.4% |
| Range | 51.8% | 15.9% |
| Mean | 9.2% | 6.4% |
| Median | 5.9% | 5.4% |
| Interquartile 25% (IQ1) | 4.7% | 4.6% |
| Interquartile 75% (IQ3) | 8.5% | 7.4% |
| Interquartile Range (IQR) | 3.8% | 2.8% |
| Standard Deviation (Sample) | 10.4% | 3.4% |
| Standard Deviation (Population) | 10.3% | 3.3% |
Similar Demographics by Unemployment
Demographics Similar to Spanish Americans by Unemployment
In terms of unemployment, the demographic groups most similar to Spanish Americans are Tlingit-Haida (5.6%, a difference of 0.0%), Cree (5.6%, a difference of 0.35%), Immigrants (5.5%, a difference of 0.36%), Immigrants from Western Asia (5.5%, a difference of 0.45%), and Marshallese (5.6%, a difference of 0.64%).
| Demographics | Rating | Rank | Unemployment |
| Immigrants | Panama | 3.4 /100 | #235 | Tragic 5.5% |
| Immigrants | Cambodia | 3.3 /100 | #236 | Tragic 5.5% |
| Moroccans | 3.2 /100 | #237 | Tragic 5.5% |
| Immigrants | Western Asia | 2.8 /100 | #238 | Tragic 5.5% |
| Immigrants | Immigrants | 2.6 /100 | #239 | Tragic 5.5% |
| Cree | 2.6 /100 | #240 | Tragic 5.6% |
| Tlingit-Haida | 2.0 /100 | #241 | Tragic 5.6% |
| Spanish Americans | 2.0 /100 | #242 | Tragic 5.6% |
| Marshallese | 1.3 /100 | #243 | Tragic 5.6% |
| Dutch West Indians | 1.2 /100 | #244 | Tragic 5.6% |
| French American Indians | 1.2 /100 | #245 | Tragic 5.6% |
| Bermudans | 1.1 /100 | #246 | Tragic 5.6% |
| Immigrants | Cameroon | 1.0 /100 | #247 | Tragic 5.6% |
| Liberians | 0.9 /100 | #248 | Tragic 5.6% |
| Cajuns | 0.8 /100 | #249 | Tragic 5.6% |
Demographics Similar to Immigrants from Liberia by Unemployment
In terms of unemployment, the demographic groups most similar to Immigrants from Liberia are Nigerian (5.8%, a difference of 0.070%), Salvadoran (5.8%, a difference of 0.090%), Sierra Leonean (5.8%, a difference of 0.13%), Immigrants from Guatemala (5.8%, a difference of 0.23%), and Immigrants from Uzbekistan (5.8%, a difference of 0.25%).
| Demographics | Rating | Rank | Unemployment |
| Yaqui | 0.2 /100 | #257 | Tragic 5.8% |
| Immigrants | Bahamas | 0.1 /100 | #258 | Tragic 5.8% |
| Sub-Saharan Africans | 0.1 /100 | #259 | Tragic 5.8% |
| Immigrants | Uzbekistan | 0.1 /100 | #260 | Tragic 5.8% |
| Immigrants | Guatemala | 0.1 /100 | #261 | Tragic 5.8% |
| Sierra Leoneans | 0.1 /100 | #262 | Tragic 5.8% |
| Salvadorans | 0.1 /100 | #263 | Tragic 5.8% |
| Immigrants | Liberia | 0.1 /100 | #264 | Tragic 5.8% |
| Nigerians | 0.1 /100 | #265 | Tragic 5.8% |
| Mexican American Indians | 0.1 /100 | #266 | Tragic 5.8% |
| Immigrants | Nigeria | 0.1 /100 | #267 | Tragic 5.8% |
| Immigrants | Sierra Leone | 0.1 /100 | #268 | Tragic 5.8% |
| Immigrants | El Salvador | 0.1 /100 | #269 | Tragic 5.8% |
| Blackfeet | 0.1 /100 | #270 | Tragic 5.8% |
| Mexicans | 0.1 /100 | #271 | Tragic 5.9% |