Spanish American Indian vs Immigrants from Latin America Unemployment Among Ages 45 to 54 years
COMPARE
Spanish American Indian
Immigrants from Latin America
Unemployment Among Ages 45 to 54 years
Unemployment Among Ages 45 to 54 years Comparison
Spanish American Indians
Immigrants from Latin America
5.1%
UNEMPLOYMENT AMONG AGES 45 TO 54 YEARS
0.0/ 100
METRIC RATING
281st/ 347
METRIC RANK
5.0%
UNEMPLOYMENT AMONG AGES 45 TO 54 YEARS
0.0/ 100
METRIC RATING
273rd/ 347
METRIC RANK
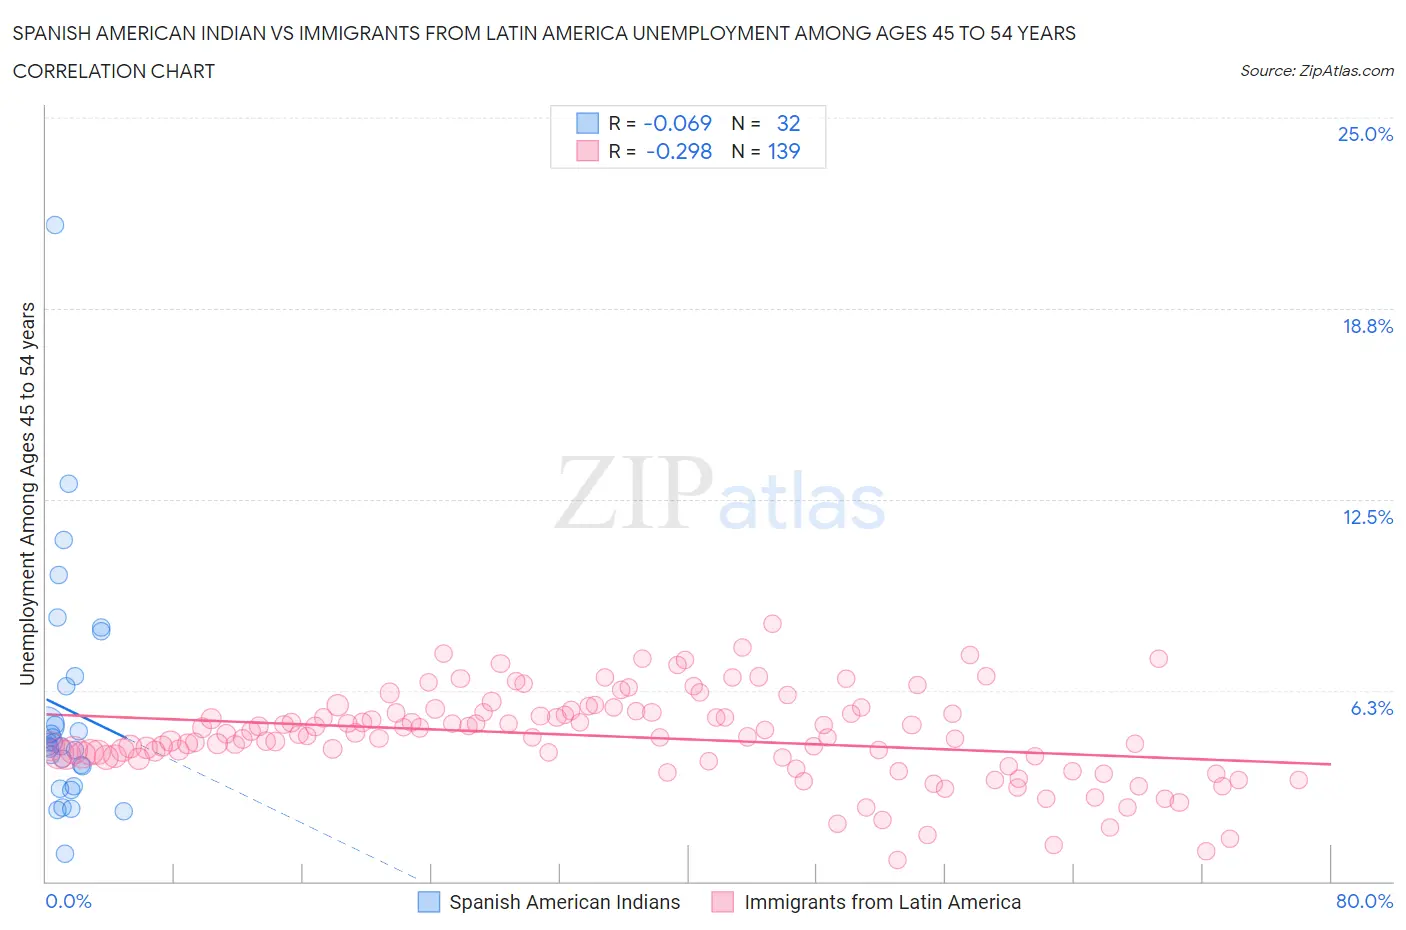
Spanish American Indian vs Immigrants from Latin America Unemployment Among Ages 45 to 54 years Correlation Chart
The statistical analysis conducted on geographies consisting of 72,831,869 people shows a slight negative correlation between the proportion of Spanish American Indians and unemployment rate among population between the ages 45 and 54 in the United States with a correlation coefficient (R) of -0.069 and weighted average of 5.1%. Similarly, the statistical analysis conducted on geographies consisting of 523,180,002 people shows a weak negative correlation between the proportion of Immigrants from Latin America and unemployment rate among population between the ages 45 and 54 in the United States with a correlation coefficient (R) of -0.298 and weighted average of 5.0%, a difference of 1.5%.
Unemployment Among Ages 45 to 54 years Correlation Summary
| Measurement | Spanish American Indian | Immigrants from Latin America |
| Minimum | 0.90% | 0.70% |
| Maximum | 21.5% | 8.4% |
| Range | 20.6% | 7.7% |
| Mean | 5.6% | 4.7% |
| Median | 4.5% | 4.8% |
| Interquartile 25% (IQ1) | 3.4% | 4.1% |
| Interquartile 75% (IQ3) | 6.6% | 5.5% |
| Interquartile Range (IQR) | 3.1% | 1.5% |
| Standard Deviation (Sample) | 4.0% | 1.4% |
| Standard Deviation (Population) | 3.9% | 1.4% |
Demographics Similar to Spanish American Indians and Immigrants from Latin America by Unemployment Among Ages 45 to 54 years
In terms of unemployment among ages 45 to 54 years, the demographic groups most similar to Spanish American Indians are Blackfeet (5.1%, a difference of 0.080%), African (5.1%, a difference of 0.15%), Nepalese (5.0%, a difference of 0.29%), Dutch West Indian (5.0%, a difference of 0.42%), and Hispanic or Latino (5.1%, a difference of 0.56%). Similarly, the demographic groups most similar to Immigrants from Latin America are U.S. Virgin Islander (5.0%, a difference of 0.050%), Bermudan (5.0%, a difference of 0.10%), Immigrants from Central America (5.0%, a difference of 0.16%), Cajun (5.0%, a difference of 0.33%), and Immigrants from Ghana (5.0%, a difference of 0.41%).
| Demographics | Rating | Rank | Unemployment Among Ages 45 to 54 years |
| Bahamians | 0.0 /100 | #267 | Tragic 4.9% |
| Immigrants | Uzbekistan | 0.0 /100 | #268 | Tragic 4.9% |
| Somalis | 0.0 /100 | #269 | Tragic 5.0% |
| Immigrants | Ghana | 0.0 /100 | #270 | Tragic 5.0% |
| Cajuns | 0.0 /100 | #271 | Tragic 5.0% |
| Immigrants | Central America | 0.0 /100 | #272 | Tragic 5.0% |
| Immigrants | Latin America | 0.0 /100 | #273 | Tragic 5.0% |
| U.S. Virgin Islanders | 0.0 /100 | #274 | Tragic 5.0% |
| Bermudans | 0.0 /100 | #275 | Tragic 5.0% |
| French American Indians | 0.0 /100 | #276 | Tragic 5.0% |
| Immigrants | Mexico | 0.0 /100 | #277 | Tragic 5.0% |
| Dutch West Indians | 0.0 /100 | #278 | Tragic 5.0% |
| Nepalese | 0.0 /100 | #279 | Tragic 5.0% |
| Blackfeet | 0.0 /100 | #280 | Tragic 5.1% |
| Spanish American Indians | 0.0 /100 | #281 | Tragic 5.1% |
| Africans | 0.0 /100 | #282 | Tragic 5.1% |
| Hispanics or Latinos | 0.0 /100 | #283 | Tragic 5.1% |
| Kiowa | 0.0 /100 | #284 | Tragic 5.1% |
| Iroquois | 0.0 /100 | #285 | Tragic 5.1% |
| Senegalese | 0.0 /100 | #286 | Tragic 5.1% |
| Haitians | 0.0 /100 | #287 | Tragic 5.2% |