Immigrants from Eastern Africa vs Immigrants from Latin America Unemployment Among Ages 45 to 54 years
COMPARE
Immigrants from Eastern Africa
Immigrants from Latin America
Unemployment Among Ages 45 to 54 years
Unemployment Among Ages 45 to 54 years Comparison
Immigrants from Eastern Africa
Immigrants from Latin America
4.4%
UNEMPLOYMENT AMONG AGES 45 TO 54 YEARS
85.1/ 100
METRIC RATING
132nd/ 347
METRIC RANK
5.0%
UNEMPLOYMENT AMONG AGES 45 TO 54 YEARS
0.0/ 100
METRIC RATING
273rd/ 347
METRIC RANK
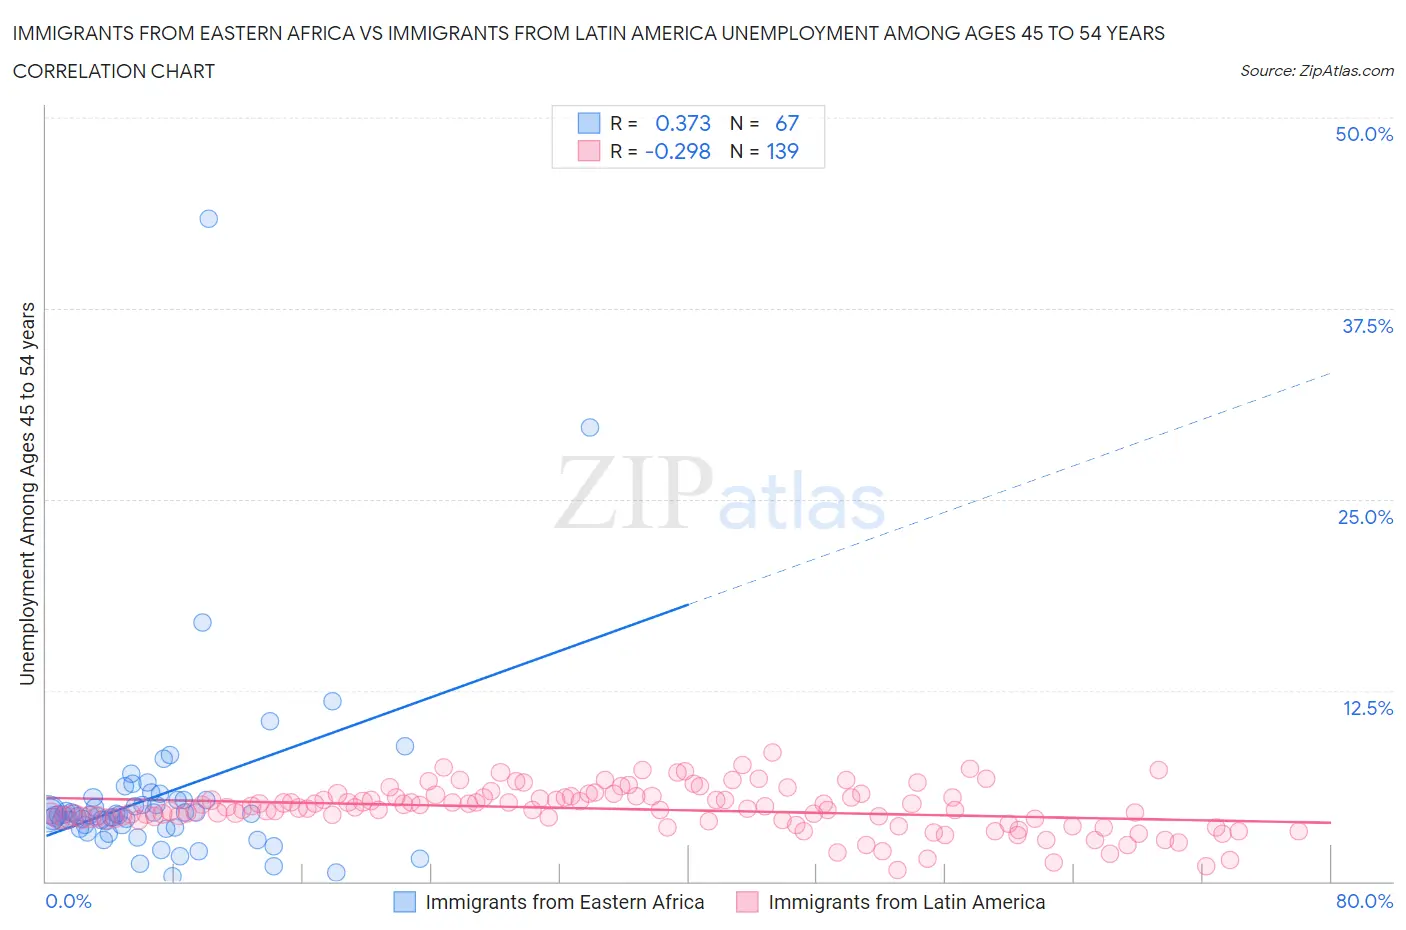
Immigrants from Eastern Africa vs Immigrants from Latin America Unemployment Among Ages 45 to 54 years Correlation Chart
The statistical analysis conducted on geographies consisting of 348,118,398 people shows a mild positive correlation between the proportion of Immigrants from Eastern Africa and unemployment rate among population between the ages 45 and 54 in the United States with a correlation coefficient (R) of 0.373 and weighted average of 4.4%. Similarly, the statistical analysis conducted on geographies consisting of 523,180,002 people shows a weak negative correlation between the proportion of Immigrants from Latin America and unemployment rate among population between the ages 45 and 54 in the United States with a correlation coefficient (R) of -0.298 and weighted average of 5.0%, a difference of 12.5%.
Unemployment Among Ages 45 to 54 years Correlation Summary
| Measurement | Immigrants from Eastern Africa | Immigrants from Latin America |
| Minimum | 0.30% | 0.70% |
| Maximum | 43.4% | 8.4% |
| Range | 43.1% | 7.7% |
| Mean | 5.6% | 4.7% |
| Median | 4.3% | 4.8% |
| Interquartile 25% (IQ1) | 3.5% | 4.1% |
| Interquartile 75% (IQ3) | 5.3% | 5.5% |
| Interquartile Range (IQR) | 1.8% | 1.5% |
| Standard Deviation (Sample) | 6.1% | 1.4% |
| Standard Deviation (Population) | 6.1% | 1.4% |
Similar Demographics by Unemployment Among Ages 45 to 54 years
Demographics Similar to Immigrants from Eastern Africa by Unemployment Among Ages 45 to 54 years
In terms of unemployment among ages 45 to 54 years, the demographic groups most similar to Immigrants from Eastern Africa are Immigrants from Cameroon (4.4%, a difference of 0.030%), Afghan (4.4%, a difference of 0.050%), Immigrants from Germany (4.4%, a difference of 0.080%), Immigrants from Eastern Asia (4.4%, a difference of 0.10%), and Celtic (4.4%, a difference of 0.11%).
| Demographics | Rating | Rank | Unemployment Among Ages 45 to 54 years |
| Immigrants | Vietnam | 88.6 /100 | #125 | Excellent 4.4% |
| Immigrants | Czechoslovakia | 87.8 /100 | #126 | Excellent 4.4% |
| Nicaraguans | 87.6 /100 | #127 | Excellent 4.4% |
| Immigrants | Northern Europe | 86.9 /100 | #128 | Excellent 4.4% |
| Laotians | 86.3 /100 | #129 | Excellent 4.4% |
| Celtics | 86.2 /100 | #130 | Excellent 4.4% |
| Immigrants | Germany | 85.9 /100 | #131 | Excellent 4.4% |
| Immigrants | Eastern Africa | 85.1 /100 | #132 | Excellent 4.4% |
| Immigrants | Cameroon | 84.8 /100 | #133 | Excellent 4.4% |
| Afghans | 84.6 /100 | #134 | Excellent 4.4% |
| Immigrants | Eastern Asia | 84.0 /100 | #135 | Excellent 4.4% |
| Immigrants | Middle Africa | 83.3 /100 | #136 | Excellent 4.4% |
| Lebanese | 81.9 /100 | #137 | Excellent 4.4% |
| Immigrants | Congo | 81.8 /100 | #138 | Excellent 4.4% |
| Immigrants | Kuwait | 81.7 /100 | #139 | Excellent 4.4% |
Demographics Similar to Immigrants from Latin America by Unemployment Among Ages 45 to 54 years
In terms of unemployment among ages 45 to 54 years, the demographic groups most similar to Immigrants from Latin America are U.S. Virgin Islander (5.0%, a difference of 0.050%), Bermudan (5.0%, a difference of 0.10%), Immigrants from Central America (5.0%, a difference of 0.16%), Cajun (5.0%, a difference of 0.33%), and Immigrants from Ghana (5.0%, a difference of 0.41%).
| Demographics | Rating | Rank | Unemployment Among Ages 45 to 54 years |
| Ghanaians | 0.0 /100 | #266 | Tragic 4.9% |
| Bahamians | 0.0 /100 | #267 | Tragic 4.9% |
| Immigrants | Uzbekistan | 0.0 /100 | #268 | Tragic 4.9% |
| Somalis | 0.0 /100 | #269 | Tragic 5.0% |
| Immigrants | Ghana | 0.0 /100 | #270 | Tragic 5.0% |
| Cajuns | 0.0 /100 | #271 | Tragic 5.0% |
| Immigrants | Central America | 0.0 /100 | #272 | Tragic 5.0% |
| Immigrants | Latin America | 0.0 /100 | #273 | Tragic 5.0% |
| U.S. Virgin Islanders | 0.0 /100 | #274 | Tragic 5.0% |
| Bermudans | 0.0 /100 | #275 | Tragic 5.0% |
| French American Indians | 0.0 /100 | #276 | Tragic 5.0% |
| Immigrants | Mexico | 0.0 /100 | #277 | Tragic 5.0% |
| Dutch West Indians | 0.0 /100 | #278 | Tragic 5.0% |
| Nepalese | 0.0 /100 | #279 | Tragic 5.0% |
| Blackfeet | 0.0 /100 | #280 | Tragic 5.1% |