South American vs Pennsylvania German Unemployment Among Ages 16 to 19 years
COMPARE
South American
Pennsylvania German
Unemployment Among Ages 16 to 19 years
Unemployment Among Ages 16 to 19 years Comparison
South Americans
Pennsylvania Germans
18.3%
UNEMPLOYMENT AMONG AGES 16 TO 19 YEARS
2.6/ 100
METRIC RATING
238th/ 347
METRIC RANK
16.2%
UNEMPLOYMENT AMONG AGES 16 TO 19 YEARS
99.9/ 100
METRIC RATING
34th/ 347
METRIC RANK
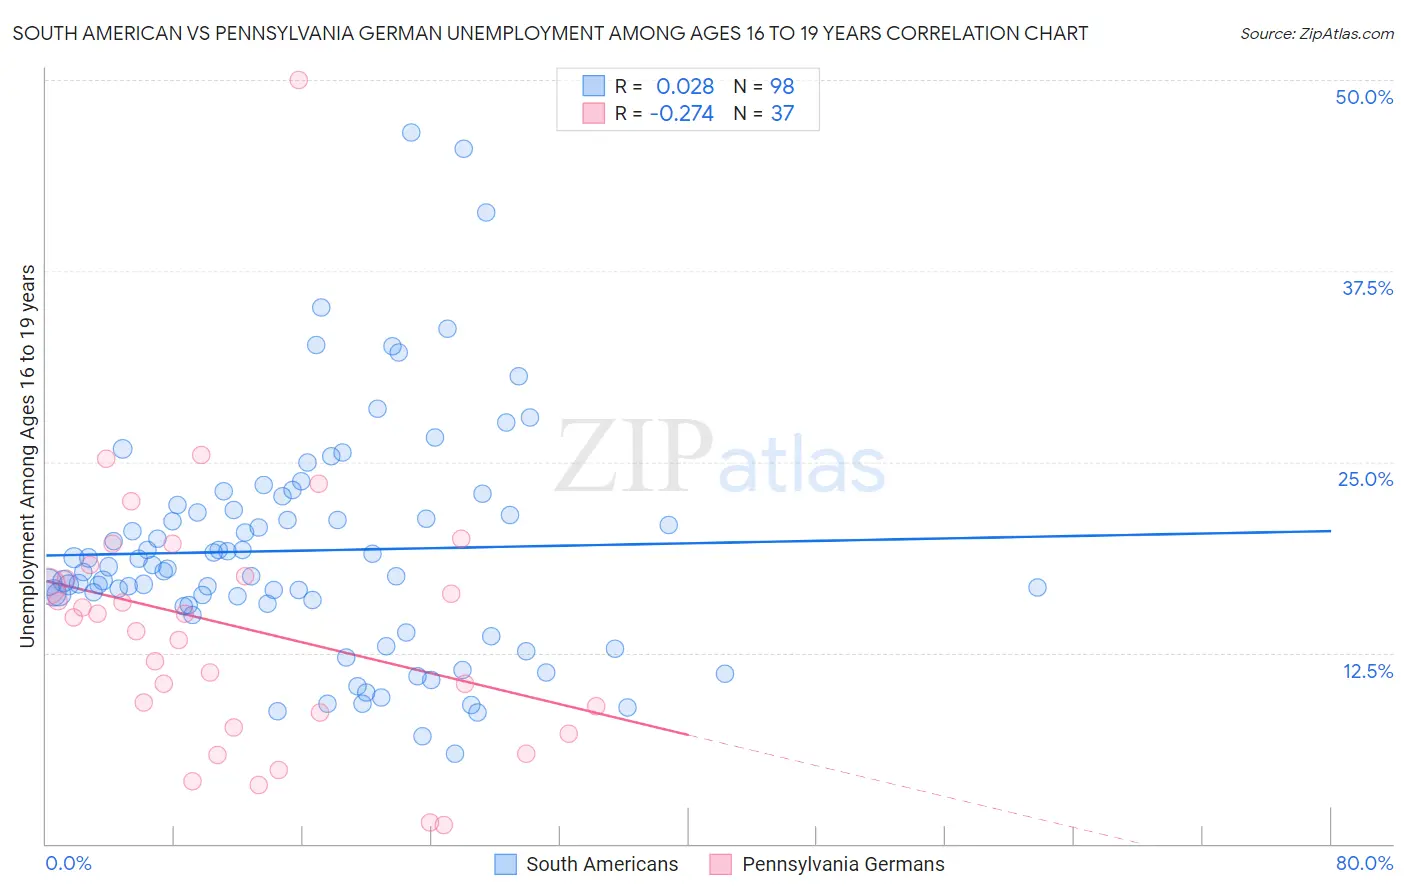
South American vs Pennsylvania German Unemployment Among Ages 16 to 19 years Correlation Chart
The statistical analysis conducted on geographies consisting of 460,023,329 people shows no correlation between the proportion of South Americans and unemployment rate among population between the ages 16 and 19 in the United States with a correlation coefficient (R) of 0.028 and weighted average of 18.3%. Similarly, the statistical analysis conducted on geographies consisting of 221,699,953 people shows a weak negative correlation between the proportion of Pennsylvania Germans and unemployment rate among population between the ages 16 and 19 in the United States with a correlation coefficient (R) of -0.274 and weighted average of 16.2%, a difference of 13.0%.
Unemployment Among Ages 16 to 19 years Correlation Summary
| Measurement | South American | Pennsylvania German |
| Minimum | 5.9% | 1.2% |
| Maximum | 46.6% | 50.0% |
| Range | 40.7% | 48.8% |
| Mean | 19.2% | 14.2% |
| Median | 17.9% | 14.8% |
| Interquartile 25% (IQ1) | 15.6% | 8.1% |
| Interquartile 75% (IQ3) | 21.9% | 17.9% |
| Interquartile Range (IQR) | 6.2% | 9.8% |
| Standard Deviation (Sample) | 7.6% | 8.9% |
| Standard Deviation (Population) | 7.6% | 8.7% |
Similar Demographics by Unemployment Among Ages 16 to 19 years
Demographics Similar to South Americans by Unemployment Among Ages 16 to 19 years
In terms of unemployment among ages 16 to 19 years, the demographic groups most similar to South Americans are Immigrants (18.3%, a difference of 0.020%), Immigrants from Colombia (18.3%, a difference of 0.030%), Native Hawaiian (18.3%, a difference of 0.080%), French American Indian (18.3%, a difference of 0.10%), and Immigrants from Cabo Verde (18.4%, a difference of 0.30%).
| Demographics | Rating | Rank | Unemployment Among Ages 16 to 19 years |
| Nepalese | 4.2 /100 | #231 | Tragic 18.2% |
| Immigrants | Russia | 4.0 /100 | #232 | Tragic 18.2% |
| Seminole | 4.0 /100 | #233 | Tragic 18.2% |
| Colombians | 3.7 /100 | #234 | Tragic 18.3% |
| French American Indians | 2.9 /100 | #235 | Tragic 18.3% |
| Immigrants | Colombia | 2.7 /100 | #236 | Tragic 18.3% |
| Immigrants | Immigrants | 2.7 /100 | #237 | Tragic 18.3% |
| South Americans | 2.6 /100 | #238 | Tragic 18.3% |
| Native Hawaiians | 2.4 /100 | #239 | Tragic 18.3% |
| Immigrants | Cabo Verde | 2.0 /100 | #240 | Tragic 18.4% |
| Immigrants | Ukraine | 1.3 /100 | #241 | Tragic 18.5% |
| Moroccans | 1.1 /100 | #242 | Tragic 18.5% |
| Mexicans | 0.9 /100 | #243 | Tragic 18.5% |
| Guatemalans | 0.8 /100 | #244 | Tragic 18.6% |
| Immigrants | Belarus | 0.8 /100 | #245 | Tragic 18.6% |
Demographics Similar to Pennsylvania Germans by Unemployment Among Ages 16 to 19 years
In terms of unemployment among ages 16 to 19 years, the demographic groups most similar to Pennsylvania Germans are Immigrants from Kenya (16.2%, a difference of 0.030%), Scottish (16.2%, a difference of 0.15%), Immigrants from South Central Asia (16.2%, a difference of 0.16%), Immigrants from Congo (16.3%, a difference of 0.27%), and Bulgarian (16.3%, a difference of 0.28%).
| Demographics | Rating | Rank | Unemployment Among Ages 16 to 19 years |
| Immigrants | Sudan | 99.9 /100 | #27 | Exceptional 16.0% |
| Jordanians | 99.9 /100 | #28 | Exceptional 16.0% |
| Chinese | 99.9 /100 | #29 | Exceptional 16.0% |
| Kenyans | 99.9 /100 | #30 | Exceptional 16.1% |
| English | 99.9 /100 | #31 | Exceptional 16.1% |
| Europeans | 99.9 /100 | #32 | Exceptional 16.1% |
| Immigrants | Kenya | 99.9 /100 | #33 | Exceptional 16.2% |
| Pennsylvania Germans | 99.9 /100 | #34 | Exceptional 16.2% |
| Scottish | 99.8 /100 | #35 | Exceptional 16.2% |
| Immigrants | South Central Asia | 99.8 /100 | #36 | Exceptional 16.2% |
| Immigrants | Congo | 99.8 /100 | #37 | Exceptional 16.3% |
| Bulgarians | 99.8 /100 | #38 | Exceptional 16.3% |
| Croatians | 99.8 /100 | #39 | Exceptional 16.3% |
| Hmong | 99.8 /100 | #40 | Exceptional 16.3% |
| Immigrants | Nepal | 99.8 /100 | #41 | Exceptional 16.3% |