South American vs Immigrants from Mexico Unemployment Among Ages 16 to 19 years
COMPARE
South American
Immigrants from Mexico
Unemployment Among Ages 16 to 19 years
Unemployment Among Ages 16 to 19 years Comparison
South Americans
Immigrants from Mexico
18.3%
UNEMPLOYMENT AMONG AGES 16 TO 19 YEARS
2.6/ 100
METRIC RATING
238th/ 347
METRIC RANK
18.9%
UNEMPLOYMENT AMONG AGES 16 TO 19 YEARS
0.2/ 100
METRIC RATING
258th/ 347
METRIC RANK
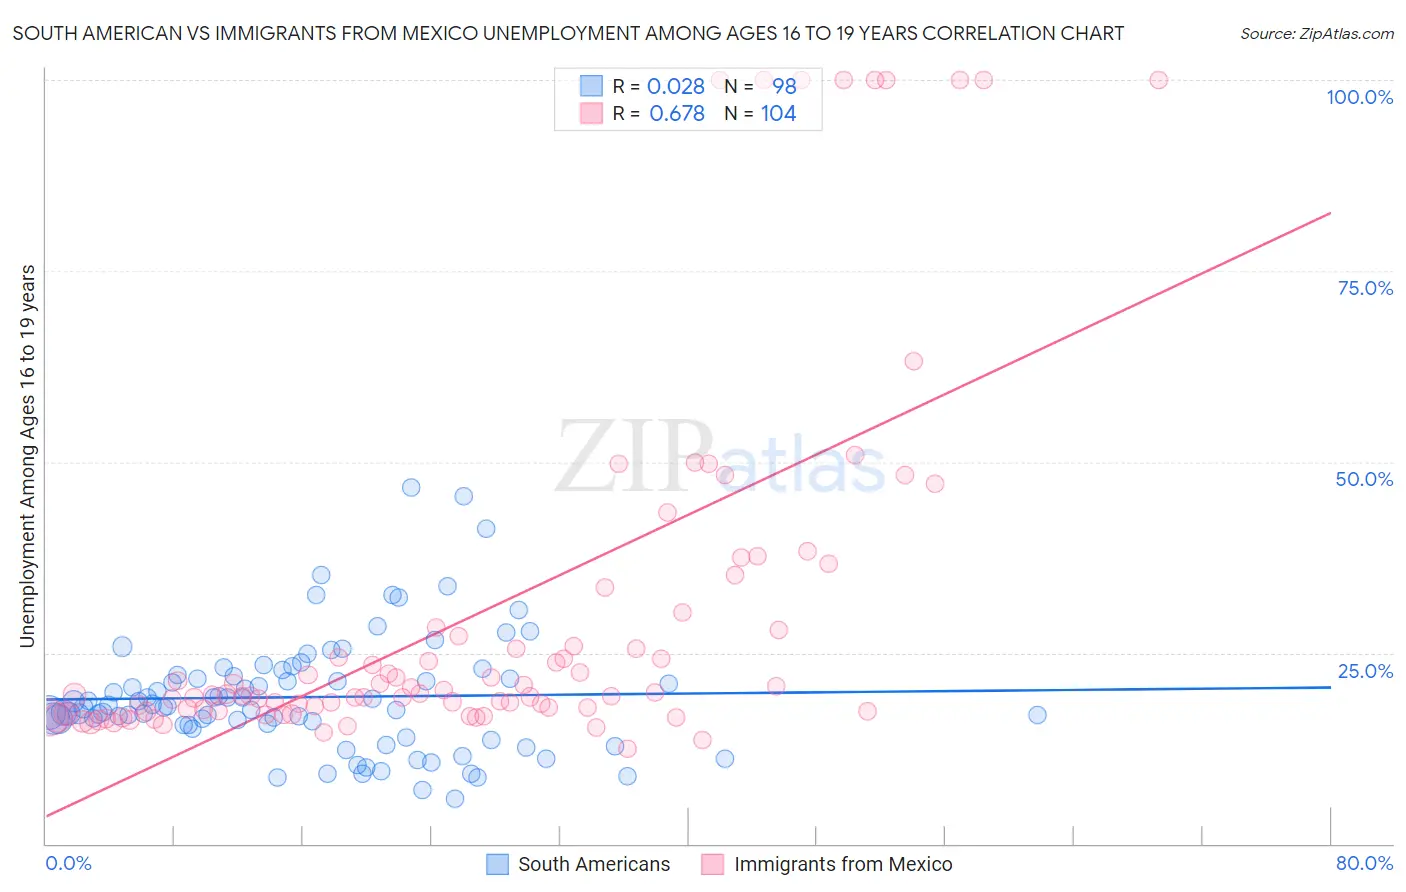
South American vs Immigrants from Mexico Unemployment Among Ages 16 to 19 years Correlation Chart
The statistical analysis conducted on geographies consisting of 460,023,329 people shows no correlation between the proportion of South Americans and unemployment rate among population between the ages 16 and 19 in the United States with a correlation coefficient (R) of 0.028 and weighted average of 18.3%. Similarly, the statistical analysis conducted on geographies consisting of 472,403,158 people shows a significant positive correlation between the proportion of Immigrants from Mexico and unemployment rate among population between the ages 16 and 19 in the United States with a correlation coefficient (R) of 0.678 and weighted average of 18.9%, a difference of 3.1%.
Unemployment Among Ages 16 to 19 years Correlation Summary
| Measurement | South American | Immigrants from Mexico |
| Minimum | 5.9% | 12.5% |
| Maximum | 46.6% | 100.0% |
| Range | 40.7% | 87.5% |
| Mean | 19.2% | 30.0% |
| Median | 17.9% | 19.5% |
| Interquartile 25% (IQ1) | 15.6% | 17.3% |
| Interquartile 75% (IQ3) | 21.9% | 28.2% |
| Interquartile Range (IQR) | 6.2% | 10.9% |
| Standard Deviation (Sample) | 7.6% | 23.8% |
| Standard Deviation (Population) | 7.6% | 23.7% |
Demographics Similar to South Americans and Immigrants from Mexico by Unemployment Among Ages 16 to 19 years
In terms of unemployment among ages 16 to 19 years, the demographic groups most similar to South Americans are Native Hawaiian (18.3%, a difference of 0.080%), Immigrants from Cabo Verde (18.4%, a difference of 0.30%), Immigrants from Ukraine (18.5%, a difference of 0.85%), Moroccan (18.5%, a difference of 1.0%), and Mexican (18.5%, a difference of 1.2%). Similarly, the demographic groups most similar to Immigrants from Mexico are Immigrants from Nigeria (18.9%, a difference of 0.14%), Mexican American Indian (18.8%, a difference of 0.40%), Apache (18.8%, a difference of 0.47%), Immigrants from Cameroon (18.8%, a difference of 0.47%), and Central American (18.8%, a difference of 0.51%).
| Demographics | Rating | Rank | Unemployment Among Ages 16 to 19 years |
| South Americans | 2.6 /100 | #238 | Tragic 18.3% |
| Native Hawaiians | 2.4 /100 | #239 | Tragic 18.3% |
| Immigrants | Cabo Verde | 2.0 /100 | #240 | Tragic 18.4% |
| Immigrants | Ukraine | 1.3 /100 | #241 | Tragic 18.5% |
| Moroccans | 1.1 /100 | #242 | Tragic 18.5% |
| Mexicans | 0.9 /100 | #243 | Tragic 18.5% |
| Guatemalans | 0.8 /100 | #244 | Tragic 18.6% |
| Immigrants | Belarus | 0.8 /100 | #245 | Tragic 18.6% |
| Immigrants | South America | 0.5 /100 | #246 | Tragic 18.7% |
| Immigrants | Israel | 0.5 /100 | #247 | Tragic 18.7% |
| Delaware | 0.5 /100 | #248 | Tragic 18.7% |
| Puget Sound Salish | 0.5 /100 | #249 | Tragic 18.7% |
| Panamanians | 0.4 /100 | #250 | Tragic 18.7% |
| Sub-Saharan Africans | 0.4 /100 | #251 | Tragic 18.7% |
| Immigrants | Guatemala | 0.4 /100 | #252 | Tragic 18.7% |
| Central Americans | 0.3 /100 | #253 | Tragic 18.8% |
| Apache | 0.3 /100 | #254 | Tragic 18.8% |
| Immigrants | Cameroon | 0.3 /100 | #255 | Tragic 18.8% |
| Mexican American Indians | 0.3 /100 | #256 | Tragic 18.8% |
| Immigrants | Nigeria | 0.2 /100 | #257 | Tragic 18.9% |
| Immigrants | Mexico | 0.2 /100 | #258 | Tragic 18.9% |