South American vs Native Hawaiian Unemployment Among Seniors over 75 years
COMPARE
South American
Native Hawaiian
Unemployment Among Seniors over 75 years
Unemployment Among Seniors over 75 years Comparison
South Americans
Native Hawaiians
8.5%
UNEMPLOYMENT AMONG SENIORS OVER 75 YEARS
87.9/ 100
METRIC RATING
140th/ 347
METRIC RANK
8.4%
UNEMPLOYMENT AMONG SENIORS OVER 75 YEARS
96.1/ 100
METRIC RATING
128th/ 347
METRIC RANK
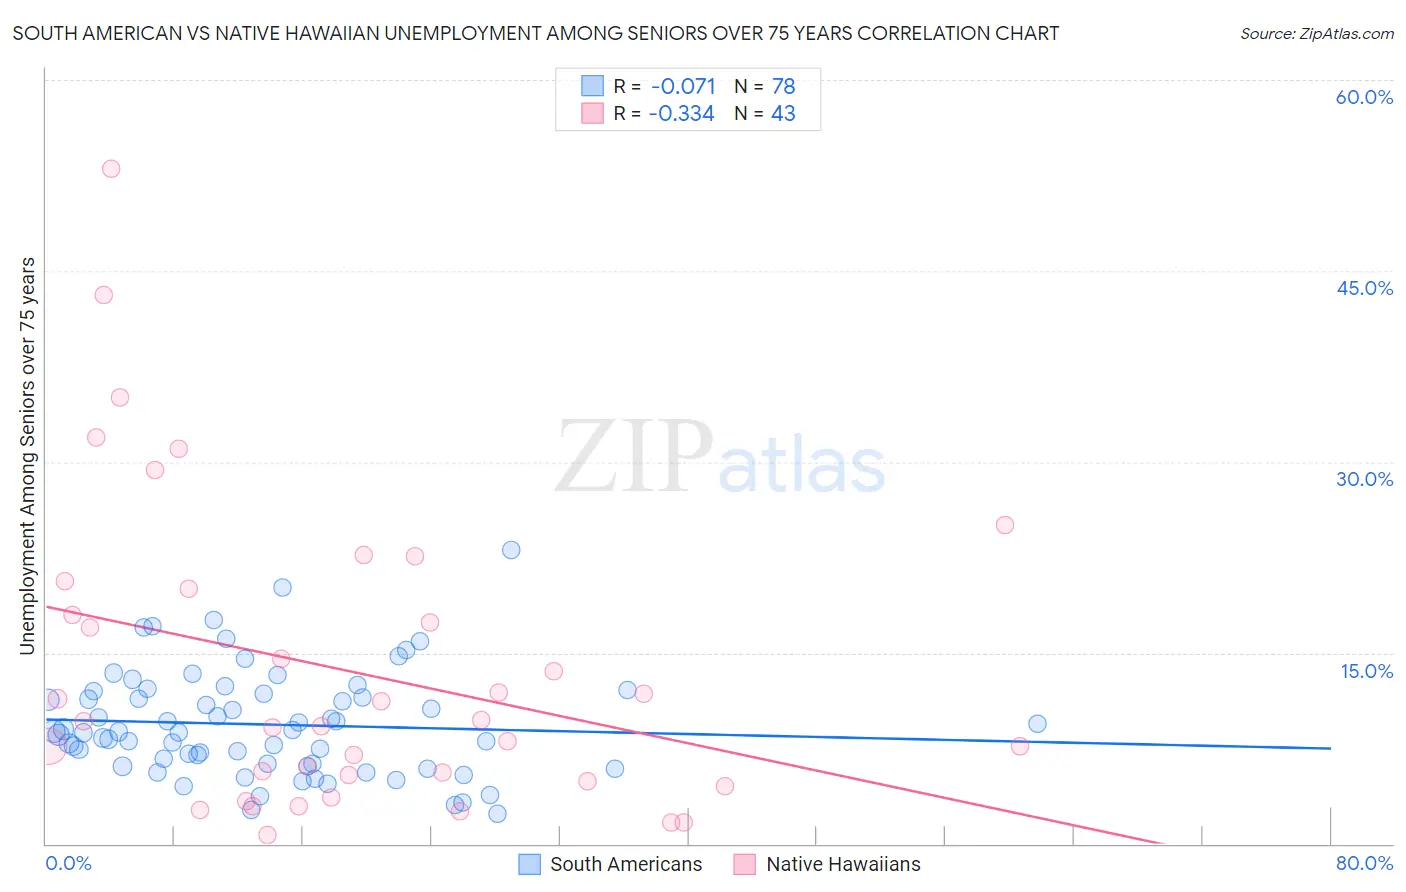
South American vs Native Hawaiian Unemployment Among Seniors over 75 years Correlation Chart
The statistical analysis conducted on geographies consisting of 225,828,000 people shows a slight negative correlation between the proportion of South Americans and unemployment rate among seniors over the age of 75 in the United States with a correlation coefficient (R) of -0.071 and weighted average of 8.5%. Similarly, the statistical analysis conducted on geographies consisting of 178,636,916 people shows a mild negative correlation between the proportion of Native Hawaiians and unemployment rate among seniors over the age of 75 in the United States with a correlation coefficient (R) of -0.334 and weighted average of 8.4%, a difference of 1.7%.
Unemployment Among Seniors over 75 years Correlation Summary
| Measurement | South American | Native Hawaiian |
| Minimum | 2.4% | 0.70% |
| Maximum | 23.1% | 53.0% |
| Range | 20.7% | 52.3% |
| Mean | 9.4% | 13.6% |
| Median | 8.8% | 9.6% |
| Interquartile 25% (IQ1) | 6.3% | 4.9% |
| Interquartile 75% (IQ3) | 11.8% | 20.0% |
| Interquartile Range (IQR) | 5.5% | 15.1% |
| Standard Deviation (Sample) | 4.1% | 11.9% |
| Standard Deviation (Population) | 4.1% | 11.8% |
Demographics Similar to South Americans and Native Hawaiians by Unemployment Among Seniors over 75 years
In terms of unemployment among seniors over 75 years, the demographic groups most similar to South Americans are Immigrants from Bolivia (8.5%, a difference of 0.0%), Barbadian (8.5%, a difference of 0.090%), Immigrants from Ukraine (8.5%, a difference of 0.11%), Immigrants from Costa Rica (8.5%, a difference of 0.14%), and Colombian (8.5%, a difference of 0.15%). Similarly, the demographic groups most similar to Native Hawaiians are Ghanaian (8.4%, a difference of 0.030%), Belizean (8.4%, a difference of 0.050%), Honduran (8.4%, a difference of 0.050%), Immigrants from Moldova (8.3%, a difference of 0.26%), and Thai (8.3%, a difference of 0.28%).
| Demographics | Rating | Rank | Unemployment Among Seniors over 75 years |
| Thais | 96.8 /100 | #124 | Exceptional 8.3% |
| Immigrants | Moldova | 96.7 /100 | #125 | Exceptional 8.3% |
| Belizeans | 96.3 /100 | #126 | Exceptional 8.4% |
| Hondurans | 96.2 /100 | #127 | Exceptional 8.4% |
| Native Hawaiians | 96.1 /100 | #128 | Exceptional 8.4% |
| Ghanaians | 96.0 /100 | #129 | Exceptional 8.4% |
| Apache | 95.2 /100 | #130 | Exceptional 8.4% |
| German Russians | 94.9 /100 | #131 | Exceptional 8.4% |
| Chileans | 93.8 /100 | #132 | Exceptional 8.4% |
| Serbians | 93.7 /100 | #133 | Exceptional 8.4% |
| Immigrants | Czechoslovakia | 93.4 /100 | #134 | Exceptional 8.4% |
| Haitians | 91.4 /100 | #135 | Exceptional 8.5% |
| Immigrants | Trinidad and Tobago | 90.8 /100 | #136 | Exceptional 8.5% |
| Immigrants | Kuwait | 90.5 /100 | #137 | Exceptional 8.5% |
| Immigrants | Bulgaria | 89.6 /100 | #138 | Excellent 8.5% |
| Barbadians | 88.6 /100 | #139 | Excellent 8.5% |
| South Americans | 87.9 /100 | #140 | Excellent 8.5% |
| Immigrants | Bolivia | 87.9 /100 | #141 | Excellent 8.5% |
| Immigrants | Ukraine | 87.0 /100 | #142 | Excellent 8.5% |
| Immigrants | Costa Rica | 86.8 /100 | #143 | Excellent 8.5% |
| Colombians | 86.7 /100 | #144 | Excellent 8.5% |