Immigrants from Lebanon vs Native Hawaiian Unemployment Among Seniors over 75 years
COMPARE
Immigrants from Lebanon
Native Hawaiian
Unemployment Among Seniors over 75 years
Unemployment Among Seniors over 75 years Comparison
Immigrants from Lebanon
Native Hawaiians
8.2%
UNEMPLOYMENT AMONG SENIORS OVER 75 YEARS
98.8/ 100
METRIC RATING
109th/ 347
METRIC RANK
8.4%
UNEMPLOYMENT AMONG SENIORS OVER 75 YEARS
96.1/ 100
METRIC RATING
128th/ 347
METRIC RANK
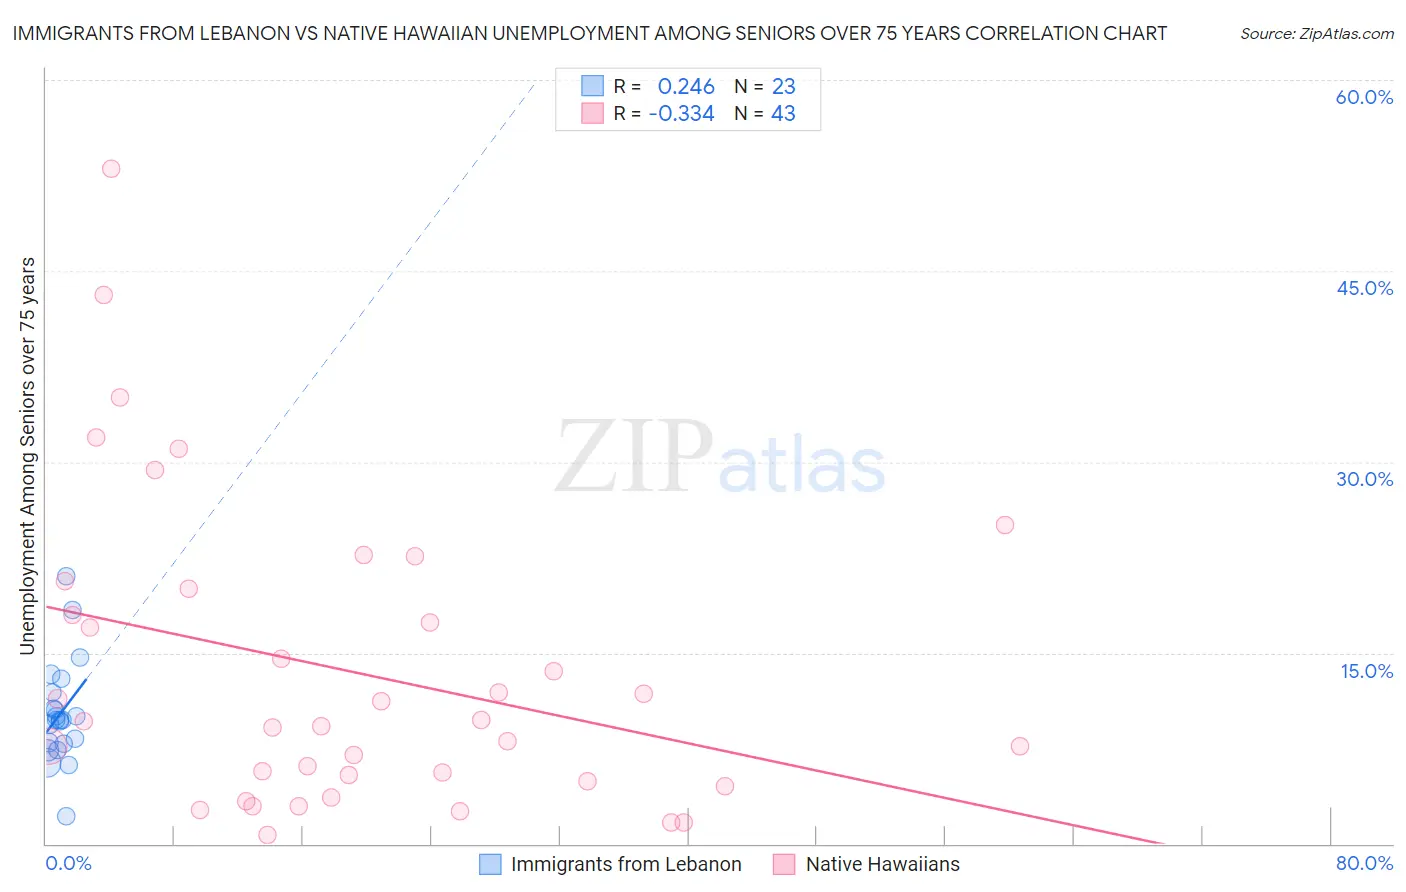
Immigrants from Lebanon vs Native Hawaiian Unemployment Among Seniors over 75 years Correlation Chart
The statistical analysis conducted on geographies consisting of 140,513,060 people shows a weak positive correlation between the proportion of Immigrants from Lebanon and unemployment rate among seniors over the age of 75 in the United States with a correlation coefficient (R) of 0.246 and weighted average of 8.2%. Similarly, the statistical analysis conducted on geographies consisting of 178,636,916 people shows a mild negative correlation between the proportion of Native Hawaiians and unemployment rate among seniors over the age of 75 in the United States with a correlation coefficient (R) of -0.334 and weighted average of 8.4%, a difference of 1.7%.
Unemployment Among Seniors over 75 years Correlation Summary
| Measurement | Immigrants from Lebanon | Native Hawaiian |
| Minimum | 2.1% | 0.70% |
| Maximum | 21.0% | 53.0% |
| Range | 18.9% | 52.3% |
| Mean | 10.2% | 13.6% |
| Median | 9.8% | 9.6% |
| Interquartile 25% (IQ1) | 7.9% | 4.9% |
| Interquartile 75% (IQ3) | 11.9% | 20.0% |
| Interquartile Range (IQR) | 4.0% | 15.1% |
| Standard Deviation (Sample) | 4.0% | 11.9% |
| Standard Deviation (Population) | 3.9% | 11.8% |
Demographics Similar to Immigrants from Lebanon and Native Hawaiians by Unemployment Among Seniors over 75 years
In terms of unemployment among seniors over 75 years, the demographic groups most similar to Immigrants from Lebanon are Laotian (8.2%, a difference of 0.020%), Marshallese (8.2%, a difference of 0.030%), French American Indian (8.2%, a difference of 0.070%), Immigrants from India (8.2%, a difference of 0.20%), and Asian (8.3%, a difference of 0.26%). Similarly, the demographic groups most similar to Native Hawaiians are Belizean (8.4%, a difference of 0.050%), Honduran (8.4%, a difference of 0.050%), Immigrants from Moldova (8.3%, a difference of 0.26%), Thai (8.3%, a difference of 0.28%), and Immigrants from Nepal (8.3%, a difference of 0.32%).
| Demographics | Rating | Rank | Unemployment Among Seniors over 75 years |
| Laotians | 98.8 /100 | #108 | Exceptional 8.2% |
| Immigrants | Lebanon | 98.8 /100 | #109 | Exceptional 8.2% |
| Marshallese | 98.7 /100 | #110 | Exceptional 8.2% |
| French American Indians | 98.7 /100 | #111 | Exceptional 8.2% |
| Immigrants | India | 98.6 /100 | #112 | Exceptional 8.2% |
| Asians | 98.5 /100 | #113 | Exceptional 8.3% |
| Trinidadians and Tobagonians | 98.4 /100 | #114 | Exceptional 8.3% |
| Sudanese | 98.2 /100 | #115 | Exceptional 8.3% |
| Immigrants | West Indies | 98.1 /100 | #116 | Exceptional 8.3% |
| Immigrants | Greece | 97.9 /100 | #117 | Exceptional 8.3% |
| Immigrants | Middle Africa | 97.9 /100 | #118 | Exceptional 8.3% |
| Japanese | 97.5 /100 | #119 | Exceptional 8.3% |
| Immigrants | Asia | 97.4 /100 | #120 | Exceptional 8.3% |
| Immigrants | Croatia | 97.2 /100 | #121 | Exceptional 8.3% |
| Immigrants | Russia | 97.1 /100 | #122 | Exceptional 8.3% |
| Immigrants | Nepal | 96.9 /100 | #123 | Exceptional 8.3% |
| Thais | 96.8 /100 | #124 | Exceptional 8.3% |
| Immigrants | Moldova | 96.7 /100 | #125 | Exceptional 8.3% |
| Belizeans | 96.3 /100 | #126 | Exceptional 8.4% |
| Hondurans | 96.2 /100 | #127 | Exceptional 8.4% |
| Native Hawaiians | 96.1 /100 | #128 | Exceptional 8.4% |