Slovak vs Immigrants from Guatemala Unemployment Among Seniors over 65 years
COMPARE
Slovak
Immigrants from Guatemala
Unemployment Among Seniors over 65 years
Unemployment Among Seniors over 65 years Comparison
Slovaks
Immigrants from Guatemala
5.1%
UNEMPLOYMENT AMONG SENIORS OVER 65 YEARS
77.9/ 100
METRIC RATING
147th/ 347
METRIC RANK
5.6%
UNEMPLOYMENT AMONG SENIORS OVER 65 YEARS
0.0/ 100
METRIC RATING
309th/ 347
METRIC RANK
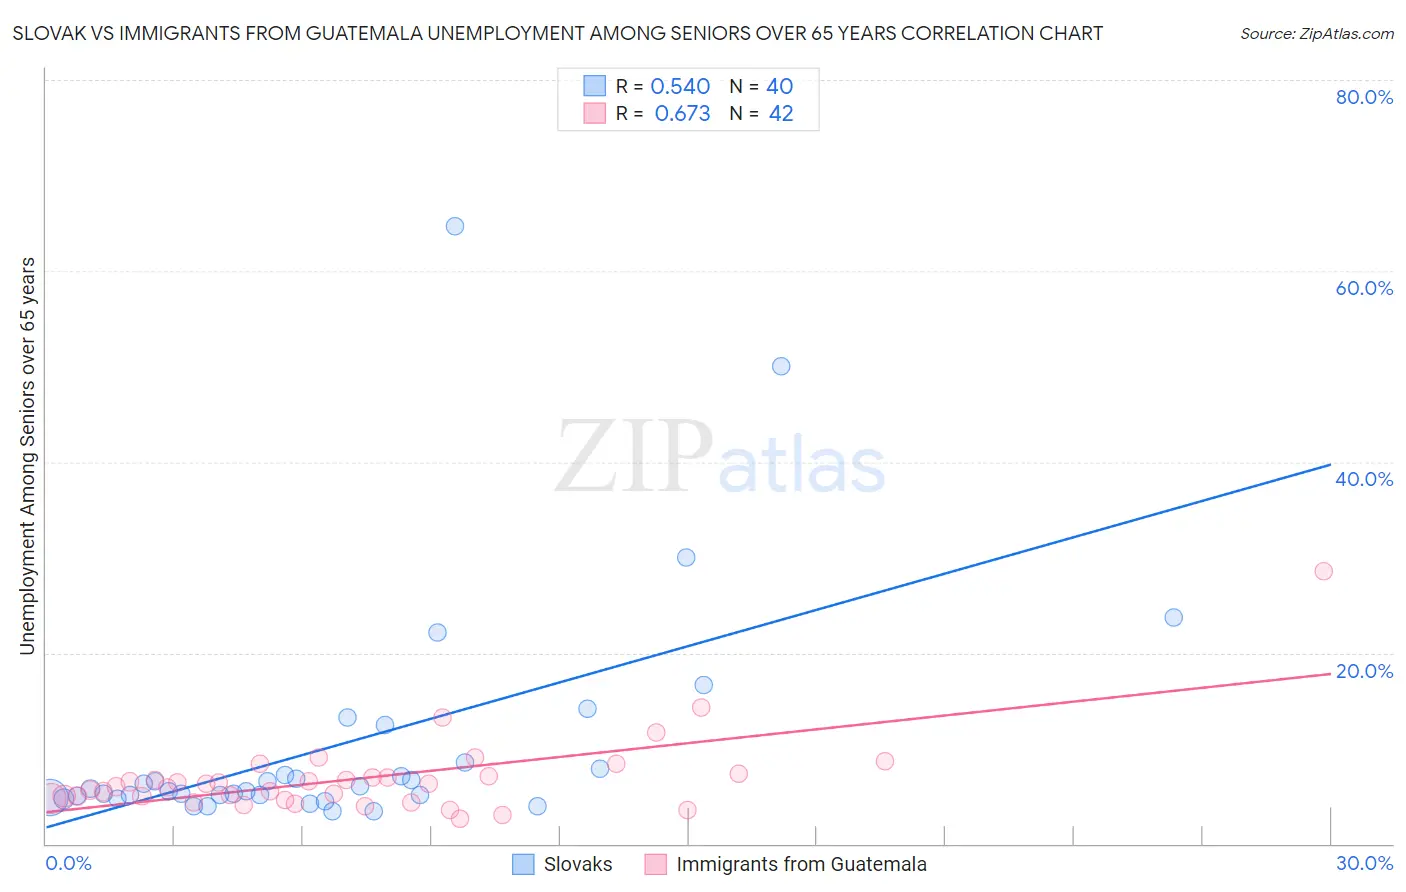
Slovak vs Immigrants from Guatemala Unemployment Among Seniors over 65 years Correlation Chart
The statistical analysis conducted on geographies consisting of 353,078,029 people shows a substantial positive correlation between the proportion of Slovaks and unemployment rate amomg seniors over the age of 65 in the United States with a correlation coefficient (R) of 0.540 and weighted average of 5.1%. Similarly, the statistical analysis conducted on geographies consisting of 340,773,453 people shows a significant positive correlation between the proportion of Immigrants from Guatemala and unemployment rate amomg seniors over the age of 65 in the United States with a correlation coefficient (R) of 0.673 and weighted average of 5.6%, a difference of 10.3%.
Unemployment Among Seniors over 65 years Correlation Summary
| Measurement | Slovak | Immigrants from Guatemala |
| Minimum | 3.4% | 2.7% |
| Maximum | 64.7% | 28.6% |
| Range | 61.3% | 25.9% |
| Mean | 10.4% | 6.9% |
| Median | 5.7% | 6.1% |
| Interquartile 25% (IQ1) | 4.9% | 4.7% |
| Interquartile 75% (IQ3) | 8.1% | 7.1% |
| Interquartile Range (IQR) | 3.2% | 2.4% |
| Standard Deviation (Sample) | 12.5% | 4.2% |
| Standard Deviation (Population) | 12.3% | 4.2% |
Similar Demographics by Unemployment Among Seniors over 65 years
Demographics Similar to Slovaks by Unemployment Among Seniors over 65 years
In terms of unemployment among seniors over 65 years, the demographic groups most similar to Slovaks are Immigrants from Russia (5.1%, a difference of 0.030%), Greek (5.1%, a difference of 0.040%), Spanish (5.1%, a difference of 0.050%), Immigrants from Afghanistan (5.1%, a difference of 0.050%), and Immigrants from Asia (5.1%, a difference of 0.10%).
| Demographics | Rating | Rank | Unemployment Among Seniors over 65 years |
| Immigrants | Chile | 83.0 /100 | #140 | Excellent 5.1% |
| Cherokee | 81.6 /100 | #141 | Excellent 5.1% |
| Immigrants | Indonesia | 81.0 /100 | #142 | Excellent 5.1% |
| Senegalese | 80.4 /100 | #143 | Excellent 5.1% |
| Poles | 80.3 /100 | #144 | Excellent 5.1% |
| Spanish | 78.8 /100 | #145 | Good 5.1% |
| Immigrants | Russia | 78.5 /100 | #146 | Good 5.1% |
| Slovaks | 77.9 /100 | #147 | Good 5.1% |
| Greeks | 77.0 /100 | #148 | Good 5.1% |
| Immigrants | Afghanistan | 76.8 /100 | #149 | Good 5.1% |
| Immigrants | Asia | 75.6 /100 | #150 | Good 5.1% |
| Pakistanis | 75.5 /100 | #151 | Good 5.1% |
| Canadians | 74.7 /100 | #152 | Good 5.1% |
| Immigrants | Czechoslovakia | 74.5 /100 | #153 | Good 5.1% |
| Immigrants | Hong Kong | 74.0 /100 | #154 | Good 5.1% |
Demographics Similar to Immigrants from Guatemala by Unemployment Among Seniors over 65 years
In terms of unemployment among seniors over 65 years, the demographic groups most similar to Immigrants from Guatemala are Salvadoran (5.6%, a difference of 0.040%), Immigrants from Guyana (5.6%, a difference of 0.18%), Immigrants from St. Vincent and the Grenadines (5.6%, a difference of 0.21%), Portuguese (5.6%, a difference of 0.30%), and Immigrants from Ecuador (5.6%, a difference of 0.31%).
| Demographics | Rating | Rank | Unemployment Among Seniors over 65 years |
| Guatemalans | 0.0 /100 | #302 | Tragic 5.6% |
| Immigrants | Latin America | 0.0 /100 | #303 | Tragic 5.6% |
| Liberians | 0.0 /100 | #304 | Tragic 5.6% |
| Mexicans | 0.0 /100 | #305 | Tragic 5.6% |
| Ecuadorians | 0.0 /100 | #306 | Tragic 5.6% |
| Portuguese | 0.0 /100 | #307 | Tragic 5.6% |
| Immigrants | St. Vincent and the Grenadines | 0.0 /100 | #308 | Tragic 5.6% |
| Immigrants | Guatemala | 0.0 /100 | #309 | Tragic 5.6% |
| Salvadorans | 0.0 /100 | #310 | Tragic 5.6% |
| Immigrants | Guyana | 0.0 /100 | #311 | Tragic 5.6% |
| Immigrants | Ecuador | 0.0 /100 | #312 | Tragic 5.6% |
| Barbadians | 0.0 /100 | #313 | Tragic 5.6% |
| Delaware | 0.0 /100 | #314 | Tragic 5.7% |
| Immigrants | El Salvador | 0.0 /100 | #315 | Tragic 5.7% |
| Immigrants | Central America | 0.0 /100 | #316 | Tragic 5.7% |