Slovak vs Immigrants from England Unemployment Among Seniors over 65 years
COMPARE
Slovak
Immigrants from England
Unemployment Among Seniors over 65 years
Unemployment Among Seniors over 65 years Comparison
Slovaks
Immigrants from England
5.1%
UNEMPLOYMENT AMONG SENIORS OVER 65 YEARS
77.9/ 100
METRIC RATING
147th/ 347
METRIC RANK
5.1%
UNEMPLOYMENT AMONG SENIORS OVER 65 YEARS
86.7/ 100
METRIC RATING
129th/ 347
METRIC RANK
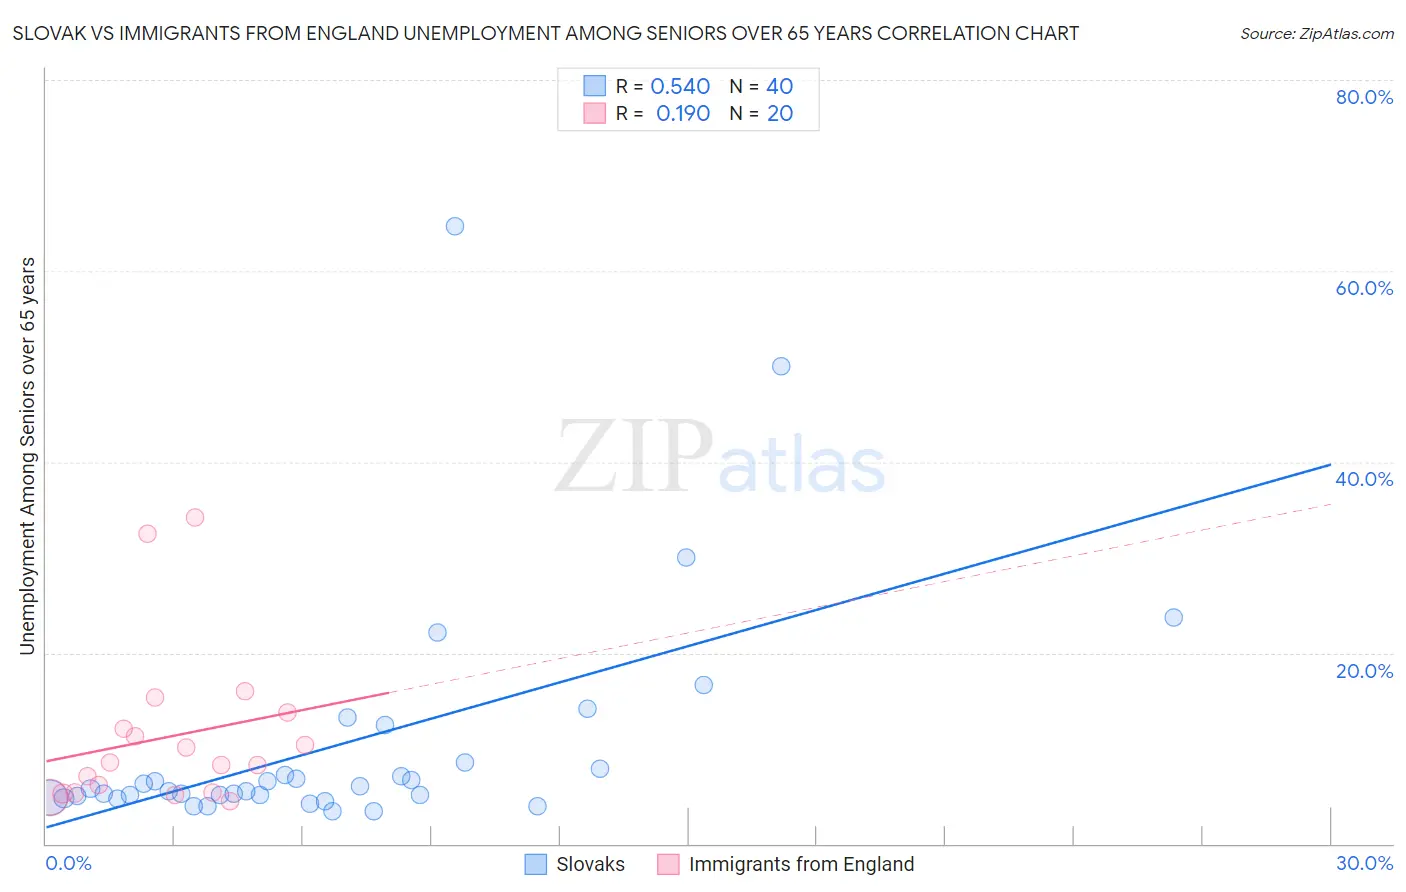
Slovak vs Immigrants from England Unemployment Among Seniors over 65 years Correlation Chart
The statistical analysis conducted on geographies consisting of 353,078,029 people shows a substantial positive correlation between the proportion of Slovaks and unemployment rate amomg seniors over the age of 65 in the United States with a correlation coefficient (R) of 0.540 and weighted average of 5.1%. Similarly, the statistical analysis conducted on geographies consisting of 353,387,046 people shows a poor positive correlation between the proportion of Immigrants from England and unemployment rate amomg seniors over the age of 65 in the United States with a correlation coefficient (R) of 0.190 and weighted average of 5.1%, a difference of 0.50%.
Unemployment Among Seniors over 65 years Correlation Summary
| Measurement | Slovak | Immigrants from England |
| Minimum | 3.4% | 4.4% |
| Maximum | 64.7% | 34.2% |
| Range | 61.3% | 29.8% |
| Mean | 10.4% | 11.2% |
| Median | 5.7% | 8.4% |
| Interquartile 25% (IQ1) | 4.9% | 5.4% |
| Interquartile 75% (IQ3) | 8.1% | 12.9% |
| Interquartile Range (IQR) | 3.2% | 7.5% |
| Standard Deviation (Sample) | 12.5% | 8.3% |
| Standard Deviation (Population) | 12.3% | 8.1% |
Demographics Similar to Slovaks and Immigrants from England by Unemployment Among Seniors over 65 years
In terms of unemployment among seniors over 65 years, the demographic groups most similar to Slovaks are Immigrants from Russia (5.1%, a difference of 0.030%), Greek (5.1%, a difference of 0.040%), Spanish (5.1%, a difference of 0.050%), Senegalese (5.1%, a difference of 0.12%), and Polish (5.1%, a difference of 0.12%). Similarly, the demographic groups most similar to Immigrants from England are Iranian (5.1%, a difference of 0.010%), Australian (5.1%, a difference of 0.030%), Immigrants from Australia (5.1%, a difference of 0.060%), Chilean (5.1%, a difference of 0.080%), and Syrian (5.1%, a difference of 0.10%).
| Demographics | Rating | Rank | Unemployment Among Seniors over 65 years |
| Australians | 87.1 /100 | #128 | Excellent 5.1% |
| Immigrants | England | 86.7 /100 | #129 | Excellent 5.1% |
| Iranians | 86.6 /100 | #130 | Excellent 5.1% |
| Immigrants | Australia | 85.8 /100 | #131 | Excellent 5.1% |
| Chileans | 85.6 /100 | #132 | Excellent 5.1% |
| Syrians | 85.3 /100 | #133 | Excellent 5.1% |
| Turks | 84.9 /100 | #134 | Excellent 5.1% |
| Ukrainians | 84.4 /100 | #135 | Excellent 5.1% |
| Whites/Caucasians | 84.4 /100 | #136 | Excellent 5.1% |
| Arabs | 84.3 /100 | #137 | Excellent 5.1% |
| New Zealanders | 83.2 /100 | #138 | Excellent 5.1% |
| Immigrants | Panama | 83.0 /100 | #139 | Excellent 5.1% |
| Immigrants | Chile | 83.0 /100 | #140 | Excellent 5.1% |
| Cherokee | 81.6 /100 | #141 | Excellent 5.1% |
| Immigrants | Indonesia | 81.0 /100 | #142 | Excellent 5.1% |
| Senegalese | 80.4 /100 | #143 | Excellent 5.1% |
| Poles | 80.3 /100 | #144 | Excellent 5.1% |
| Spanish | 78.8 /100 | #145 | Good 5.1% |
| Immigrants | Russia | 78.5 /100 | #146 | Good 5.1% |
| Slovaks | 77.9 /100 | #147 | Good 5.1% |
| Greeks | 77.0 /100 | #148 | Good 5.1% |