Sioux vs Native/Alaskan Unemployment Among Ages 20 to 24 years
COMPARE
Sioux
Native/Alaskan
Unemployment Among Ages 20 to 24 years
Unemployment Among Ages 20 to 24 years Comparison
Sioux
Natives/Alaskans
14.2%
UNEMPLOYMENT AMONG AGES 20 TO 24 YEARS
0.0/ 100
METRIC RATING
335th/ 347
METRIC RANK
13.0%
UNEMPLOYMENT AMONG AGES 20 TO 24 YEARS
0.0/ 100
METRIC RATING
322nd/ 347
METRIC RANK
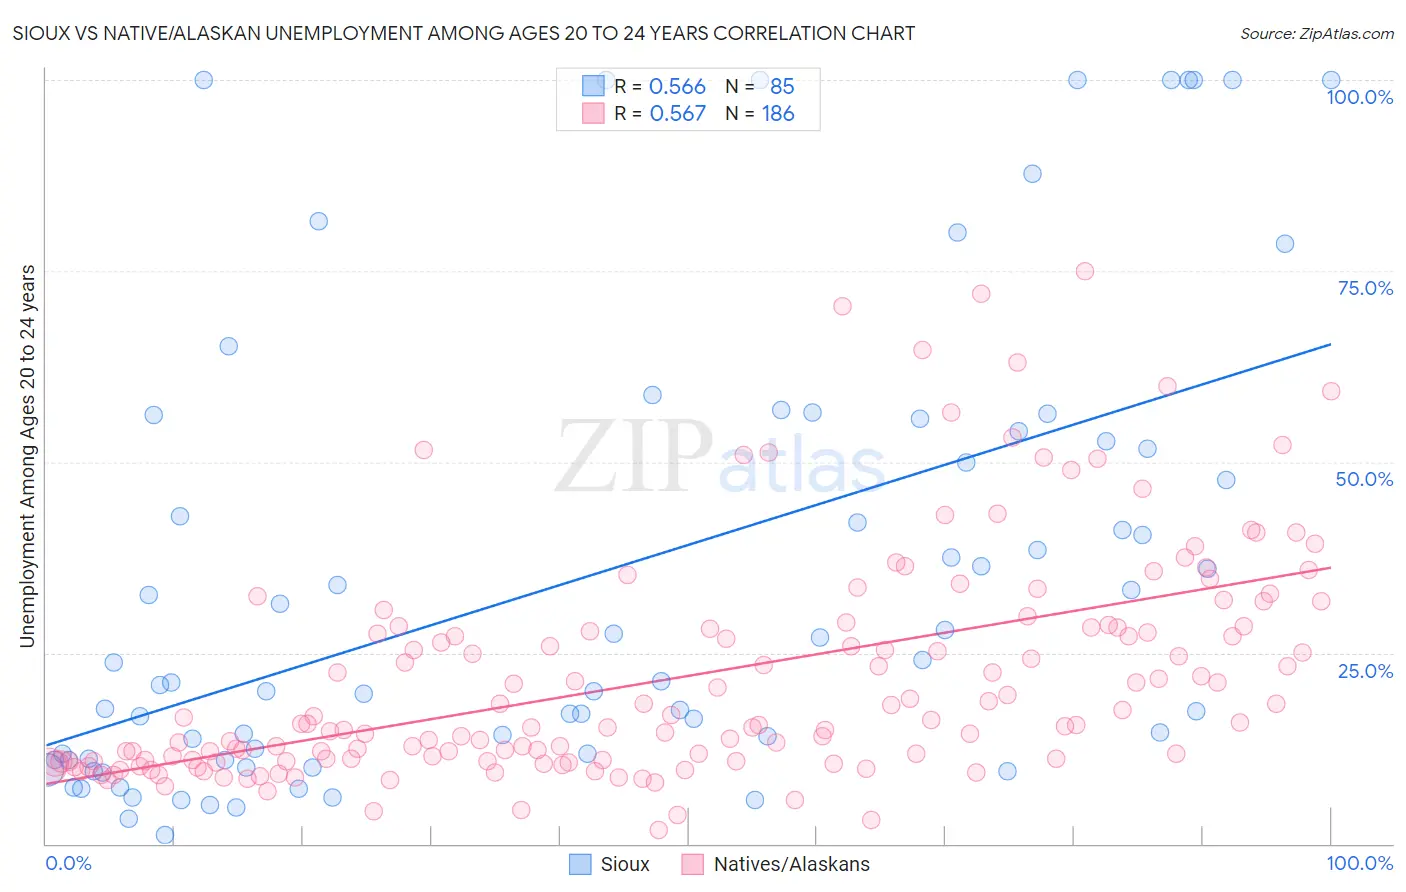
Sioux vs Native/Alaskan Unemployment Among Ages 20 to 24 years Correlation Chart
The statistical analysis conducted on geographies consisting of 227,624,418 people shows a substantial positive correlation between the proportion of Sioux and unemployment rate among population between the ages 20 and 24 in the United States with a correlation coefficient (R) of 0.566 and weighted average of 14.2%. Similarly, the statistical analysis conducted on geographies consisting of 484,471,269 people shows a substantial positive correlation between the proportion of Natives/Alaskans and unemployment rate among population between the ages 20 and 24 in the United States with a correlation coefficient (R) of 0.567 and weighted average of 13.0%, a difference of 8.8%.
Unemployment Among Ages 20 to 24 years Correlation Summary
| Measurement | Sioux | Native/Alaskan |
| Minimum | 1.1% | 1.8% |
| Maximum | 100.0% | 75.0% |
| Range | 98.9% | 73.2% |
| Mean | 35.1% | 21.9% |
| Median | 21.2% | 15.7% |
| Interquartile 25% (IQ1) | 11.0% | 10.9% |
| Interquartile 75% (IQ3) | 53.3% | 28.3% |
| Interquartile Range (IQR) | 42.3% | 17.5% |
| Standard Deviation (Sample) | 30.2% | 14.8% |
| Standard Deviation (Population) | 30.0% | 14.8% |
Demographics Similar to Sioux and Natives/Alaskans by Unemployment Among Ages 20 to 24 years
In terms of unemployment among ages 20 to 24 years, the demographic groups most similar to Sioux are Pima (14.2%, a difference of 0.21%), Guyanese (14.0%, a difference of 1.2%), Paiute (14.3%, a difference of 1.3%), Immigrants from St. Vincent and the Grenadines (14.3%, a difference of 1.3%), and Immigrants from Guyana (13.9%, a difference of 1.7%). Similarly, the demographic groups most similar to Natives/Alaskans are Immigrants from Jamaica (13.0%, a difference of 0.38%), Cheyenne (13.0%, a difference of 0.47%), Yakama (13.1%, a difference of 0.48%), Trinidadian and Tobagonian (12.9%, a difference of 0.89%), and Barbadian (12.9%, a difference of 1.1%).
| Demographics | Rating | Rank | Unemployment Among Ages 20 to 24 years |
| Barbadians | 0.0 /100 | #318 | Tragic 12.9% |
| Trinidadians and Tobagonians | 0.0 /100 | #319 | Tragic 12.9% |
| Cheyenne | 0.0 /100 | #320 | Tragic 13.0% |
| Immigrants | Jamaica | 0.0 /100 | #321 | Tragic 13.0% |
| Natives/Alaskans | 0.0 /100 | #322 | Tragic 13.0% |
| Yakama | 0.0 /100 | #323 | Tragic 13.1% |
| Alaska Natives | 0.0 /100 | #324 | Tragic 13.2% |
| Pueblo | 0.0 /100 | #325 | Tragic 13.2% |
| Immigrants | Barbados | 0.0 /100 | #326 | Tragic 13.5% |
| Immigrants | Dominican Republic | 0.0 /100 | #327 | Tragic 13.6% |
| British West Indians | 0.0 /100 | #328 | Tragic 13.7% |
| Dominicans | 0.0 /100 | #329 | Tragic 13.8% |
| Arapaho | 0.0 /100 | #330 | Tragic 13.8% |
| Aleuts | 0.0 /100 | #331 | Tragic 13.8% |
| Immigrants | Grenada | 0.0 /100 | #332 | Tragic 13.8% |
| Immigrants | Guyana | 0.0 /100 | #333 | Tragic 13.9% |
| Guyanese | 0.0 /100 | #334 | Tragic 14.0% |
| Sioux | 0.0 /100 | #335 | Tragic 14.2% |
| Pima | 0.0 /100 | #336 | Tragic 14.2% |
| Paiute | 0.0 /100 | #337 | Tragic 14.3% |
| Immigrants | St. Vincent and the Grenadines | 0.0 /100 | #338 | Tragic 14.3% |