Serbian vs Zimbabwean Unemployment Among Ages 45 to 54 years
COMPARE
Serbian
Zimbabwean
Unemployment Among Ages 45 to 54 years
Unemployment Among Ages 45 to 54 years Comparison
Serbians
Zimbabweans
4.3%
UNEMPLOYMENT AMONG AGES 45 TO 54 YEARS
97.9/ 100
METRIC RATING
79th/ 347
METRIC RANK
4.2%
UNEMPLOYMENT AMONG AGES 45 TO 54 YEARS
99.8/ 100
METRIC RATING
43rd/ 347
METRIC RANK
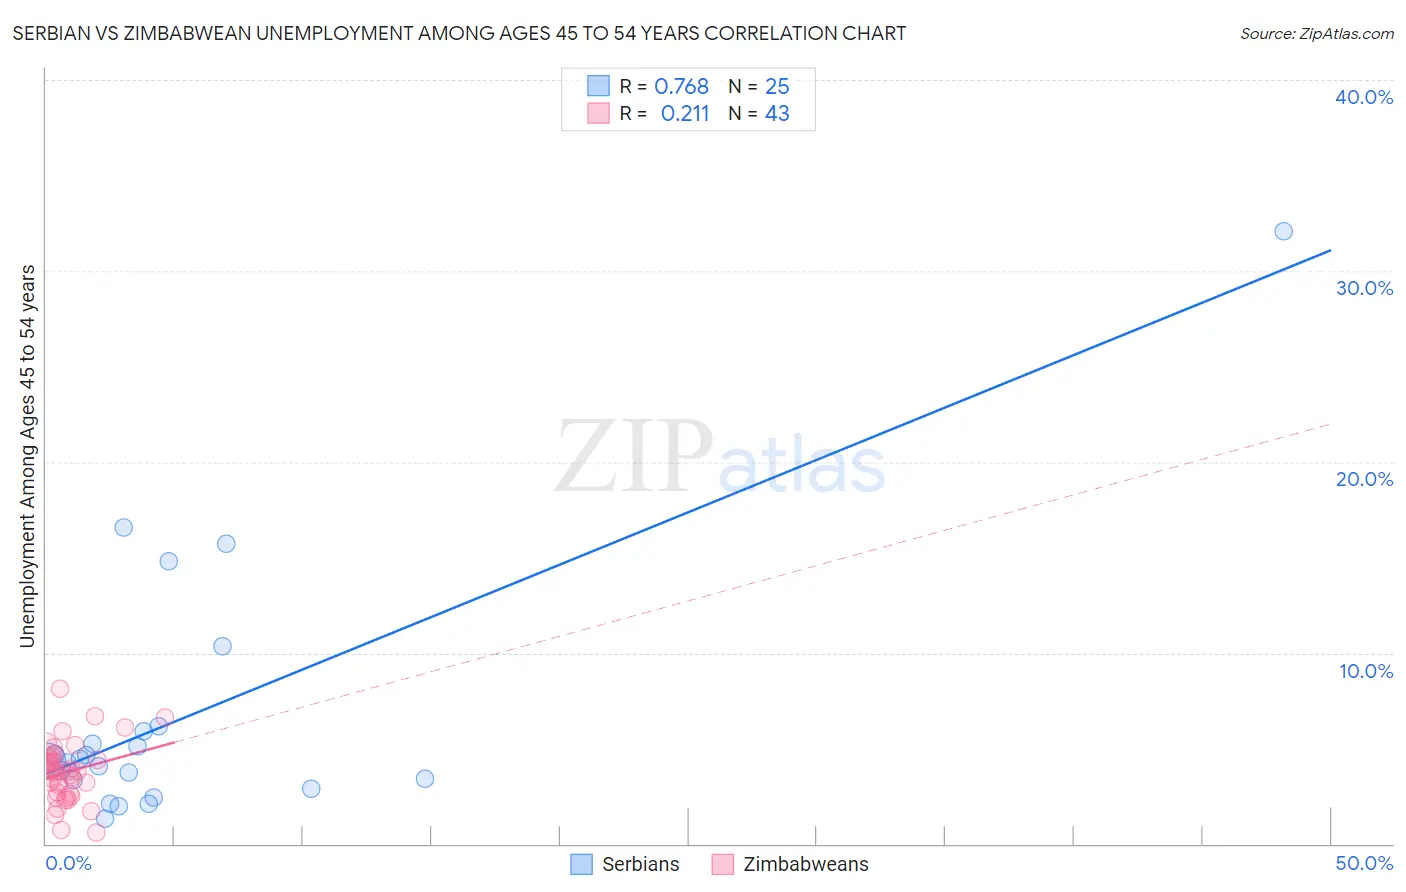
Serbian vs Zimbabwean Unemployment Among Ages 45 to 54 years Correlation Chart
The statistical analysis conducted on geographies consisting of 262,424,593 people shows a strong positive correlation between the proportion of Serbians and unemployment rate among population between the ages 45 and 54 in the United States with a correlation coefficient (R) of 0.768 and weighted average of 4.3%. Similarly, the statistical analysis conducted on geographies consisting of 68,871,465 people shows a weak positive correlation between the proportion of Zimbabweans and unemployment rate among population between the ages 45 and 54 in the United States with a correlation coefficient (R) of 0.211 and weighted average of 4.2%, a difference of 2.7%.
Unemployment Among Ages 45 to 54 years Correlation Summary
| Measurement | Serbian | Zimbabwean |
| Minimum | 1.3% | 0.60% |
| Maximum | 32.1% | 8.1% |
| Range | 30.8% | 7.5% |
| Mean | 6.6% | 3.8% |
| Median | 4.3% | 3.8% |
| Interquartile 25% (IQ1) | 3.1% | 2.6% |
| Interquartile 75% (IQ3) | 6.0% | 4.5% |
| Interquartile Range (IQR) | 2.9% | 1.9% |
| Standard Deviation (Sample) | 6.8% | 1.6% |
| Standard Deviation (Population) | 6.6% | 1.5% |
Similar Demographics by Unemployment Among Ages 45 to 54 years
Demographics Similar to Serbians by Unemployment Among Ages 45 to 54 years
In terms of unemployment among ages 45 to 54 years, the demographic groups most similar to Serbians are German Russian (4.3%, a difference of 0.0%), Cambodian (4.3%, a difference of 0.060%), Chilean (4.3%, a difference of 0.090%), Kenyan (4.3%, a difference of 0.15%), and Slavic (4.3%, a difference of 0.15%).
| Demographics | Rating | Rank | Unemployment Among Ages 45 to 54 years |
| Whites/Caucasians | 98.4 /100 | #72 | Exceptional 4.3% |
| Canadians | 98.2 /100 | #73 | Exceptional 4.3% |
| Immigrants | Belgium | 98.2 /100 | #74 | Exceptional 4.3% |
| Kenyans | 98.1 /100 | #75 | Exceptional 4.3% |
| Slavs | 98.1 /100 | #76 | Exceptional 4.3% |
| Chileans | 98.1 /100 | #77 | Exceptional 4.3% |
| German Russians | 97.9 /100 | #78 | Exceptional 4.3% |
| Serbians | 97.9 /100 | #79 | Exceptional 4.3% |
| Cambodians | 97.8 /100 | #80 | Exceptional 4.3% |
| Immigrants | Micronesia | 97.6 /100 | #81 | Exceptional 4.3% |
| Eastern Europeans | 97.6 /100 | #82 | Exceptional 4.3% |
| Australians | 97.4 /100 | #83 | Exceptional 4.3% |
| Italians | 97.3 /100 | #84 | Exceptional 4.3% |
| French | 97.3 /100 | #85 | Exceptional 4.3% |
| Ethiopians | 97.2 /100 | #86 | Exceptional 4.3% |
Demographics Similar to Zimbabweans by Unemployment Among Ages 45 to 54 years
In terms of unemployment among ages 45 to 54 years, the demographic groups most similar to Zimbabweans are Immigrants from Scotland (4.2%, a difference of 0.010%), Czechoslovakian (4.2%, a difference of 0.050%), Northern European (4.2%, a difference of 0.070%), Immigrants from Singapore (4.2%, a difference of 0.26%), and Jordanian (4.2%, a difference of 0.27%).
| Demographics | Rating | Rank | Unemployment Among Ages 45 to 54 years |
| Croatians | 99.8 /100 | #36 | Exceptional 4.2% |
| Osage | 99.8 /100 | #37 | Exceptional 4.2% |
| Scotch-Irish | 99.8 /100 | #38 | Exceptional 4.2% |
| Jordanians | 99.8 /100 | #39 | Exceptional 4.2% |
| Northern Europeans | 99.8 /100 | #40 | Exceptional 4.2% |
| Czechoslovakians | 99.8 /100 | #41 | Exceptional 4.2% |
| Immigrants | Scotland | 99.8 /100 | #42 | Exceptional 4.2% |
| Zimbabweans | 99.8 /100 | #43 | Exceptional 4.2% |
| Immigrants | Singapore | 99.7 /100 | #44 | Exceptional 4.2% |
| Immigrants | Bulgaria | 99.7 /100 | #45 | Exceptional 4.2% |
| Luxembourgers | 99.6 /100 | #46 | Exceptional 4.2% |
| Filipinos | 99.6 /100 | #47 | Exceptional 4.2% |
| Finns | 99.6 /100 | #48 | Exceptional 4.2% |
| Immigrants | Zimbabwe | 99.6 /100 | #49 | Exceptional 4.2% |
| Basques | 99.6 /100 | #50 | Exceptional 4.2% |