Serbian vs Lithuanian Unemployment Among Women with Children Under 18 years
COMPARE
Serbian
Lithuanian
Unemployment Among Women with Children Under 18 years
Unemployment Among Women with Children Under 18 years Comparison
Serbians
Lithuanians
5.1%
UNEMPLOYMENT AMONG WOMEN WITH CHILDREN UNDER 18 YEARS
96.5/ 100
METRIC RATING
71st/ 347
METRIC RANK
5.0%
UNEMPLOYMENT AMONG WOMEN WITH CHILDREN UNDER 18 YEARS
98.4/ 100
METRIC RATING
49th/ 347
METRIC RANK
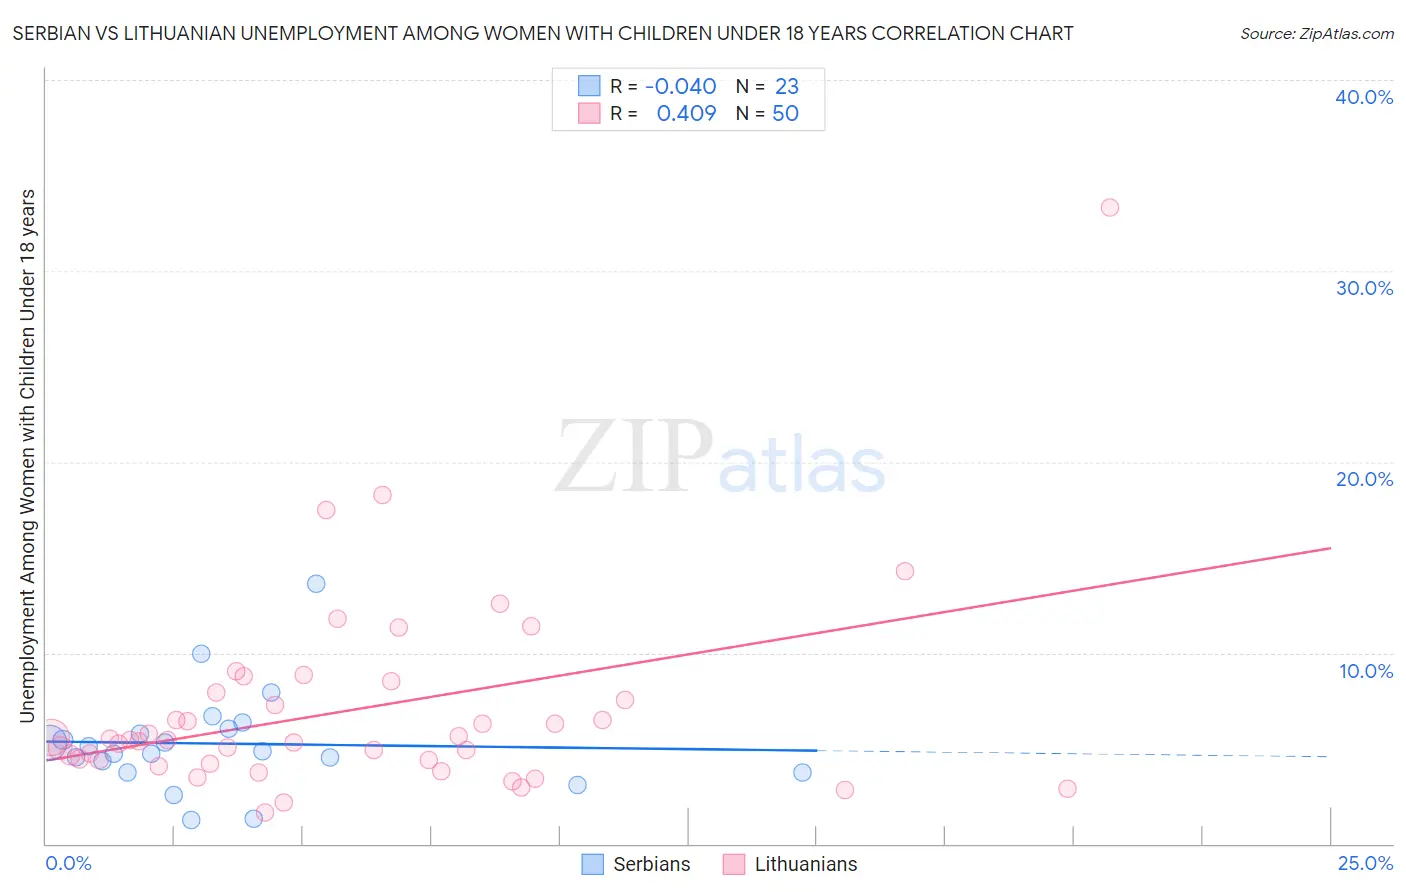
Serbian vs Lithuanian Unemployment Among Women with Children Under 18 years Correlation Chart
The statistical analysis conducted on geographies consisting of 258,896,879 people shows no correlation between the proportion of Serbians and unemployment rate among women with children under the age of 18 in the United States with a correlation coefficient (R) of -0.040 and weighted average of 5.1%. Similarly, the statistical analysis conducted on geographies consisting of 398,499,759 people shows a moderate positive correlation between the proportion of Lithuanians and unemployment rate among women with children under the age of 18 in the United States with a correlation coefficient (R) of 0.409 and weighted average of 5.0%, a difference of 1.5%.
Unemployment Among Women with Children Under 18 years Correlation Summary
| Measurement | Serbian | Lithuanian |
| Minimum | 1.2% | 1.6% |
| Maximum | 13.6% | 33.3% |
| Range | 12.4% | 31.7% |
| Mean | 5.2% | 7.0% |
| Median | 4.8% | 5.4% |
| Interquartile 25% (IQ1) | 3.7% | 4.4% |
| Interquartile 75% (IQ3) | 6.0% | 7.9% |
| Interquartile Range (IQR) | 2.3% | 3.5% |
| Standard Deviation (Sample) | 2.6% | 5.2% |
| Standard Deviation (Population) | 2.6% | 5.2% |
Similar Demographics by Unemployment Among Women with Children Under 18 years
Demographics Similar to Serbians by Unemployment Among Women with Children Under 18 years
In terms of unemployment among women with children under 18 years, the demographic groups most similar to Serbians are Austrian (5.1%, a difference of 0.040%), Icelander (5.1%, a difference of 0.040%), Irish (5.1%, a difference of 0.18%), Immigrants from Bolivia (5.1%, a difference of 0.22%), and Fijian (5.1%, a difference of 0.27%).
| Demographics | Rating | Rank | Unemployment Among Women with Children Under 18 years |
| Estonians | 97.2 /100 | #64 | Exceptional 5.1% |
| Immigrants | Sweden | 97.1 /100 | #65 | Exceptional 5.1% |
| Immigrants | Australia | 97.0 /100 | #66 | Exceptional 5.1% |
| Fijians | 96.9 /100 | #67 | Exceptional 5.1% |
| Irish | 96.8 /100 | #68 | Exceptional 5.1% |
| Austrians | 96.6 /100 | #69 | Exceptional 5.1% |
| Icelanders | 96.6 /100 | #70 | Exceptional 5.1% |
| Serbians | 96.5 /100 | #71 | Exceptional 5.1% |
| Immigrants | Bolivia | 96.1 /100 | #72 | Exceptional 5.1% |
| Albanians | 95.9 /100 | #73 | Exceptional 5.1% |
| Immigrants | Northern Europe | 95.9 /100 | #74 | Exceptional 5.1% |
| Immigrants | Asia | 95.8 /100 | #75 | Exceptional 5.1% |
| Puget Sound Salish | 95.8 /100 | #76 | Exceptional 5.1% |
| Zimbabweans | 95.7 /100 | #77 | Exceptional 5.1% |
| Assyrians/Chaldeans/Syriacs | 95.7 /100 | #78 | Exceptional 5.1% |
Demographics Similar to Lithuanians by Unemployment Among Women with Children Under 18 years
In terms of unemployment among women with children under 18 years, the demographic groups most similar to Lithuanians are Immigrants from Japan (5.0%, a difference of 0.030%), Yugoslavian (5.1%, a difference of 0.11%), Immigrants from Nepal (5.1%, a difference of 0.11%), Scottish (5.1%, a difference of 0.20%), and Northern European (5.0%, a difference of 0.22%).
| Demographics | Rating | Rank | Unemployment Among Women with Children Under 18 years |
| Eastern Europeans | 98.9 /100 | #42 | Exceptional 5.0% |
| Turks | 98.9 /100 | #43 | Exceptional 5.0% |
| Immigrants | Moldova | 98.9 /100 | #44 | Exceptional 5.0% |
| Immigrants | Malaysia | 98.8 /100 | #45 | Exceptional 5.0% |
| Immigrants | Korea | 98.7 /100 | #46 | Exceptional 5.0% |
| British | 98.7 /100 | #47 | Exceptional 5.0% |
| Northern Europeans | 98.6 /100 | #48 | Exceptional 5.0% |
| Lithuanians | 98.4 /100 | #49 | Exceptional 5.0% |
| Immigrants | Japan | 98.4 /100 | #50 | Exceptional 5.0% |
| Yugoslavians | 98.3 /100 | #51 | Exceptional 5.1% |
| Immigrants | Nepal | 98.3 /100 | #52 | Exceptional 5.1% |
| Scottish | 98.2 /100 | #53 | Exceptional 5.1% |
| Immigrants | Serbia | 98.2 /100 | #54 | Exceptional 5.1% |
| Immigrants | Sri Lanka | 98.1 /100 | #55 | Exceptional 5.1% |
| Immigrants | Ireland | 98.0 /100 | #56 | Exceptional 5.1% |