Scandinavian vs Immigrants from Armenia Unemployment Among Seniors over 65 years
COMPARE
Scandinavian
Immigrants from Armenia
Unemployment Among Seniors over 65 years
Unemployment Among Seniors over 65 years Comparison
Scandinavians
Immigrants from Armenia
4.9%
UNEMPLOYMENT AMONG SENIORS OVER 65 YEARS
99.8/ 100
METRIC RATING
58th/ 347
METRIC RANK
6.2%
UNEMPLOYMENT AMONG SENIORS OVER 65 YEARS
0.0/ 100
METRIC RATING
335th/ 347
METRIC RANK
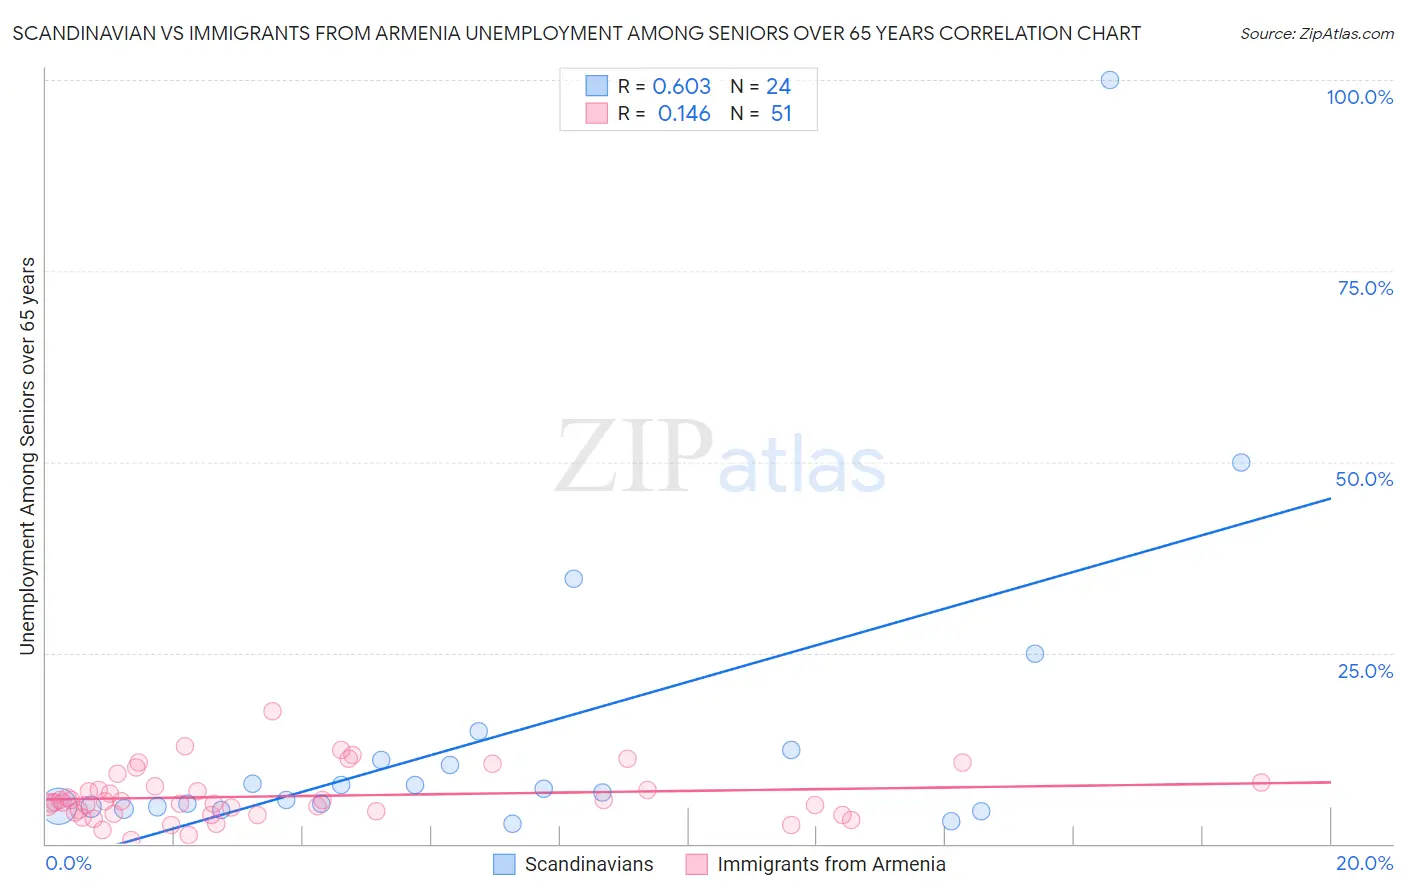
Scandinavian vs Immigrants from Armenia Unemployment Among Seniors over 65 years Correlation Chart
The statistical analysis conducted on geographies consisting of 401,897,876 people shows a significant positive correlation between the proportion of Scandinavians and unemployment rate amomg seniors over the age of 65 in the United States with a correlation coefficient (R) of 0.603 and weighted average of 4.9%. Similarly, the statistical analysis conducted on geographies consisting of 95,751,905 people shows a poor positive correlation between the proportion of Immigrants from Armenia and unemployment rate amomg seniors over the age of 65 in the United States with a correlation coefficient (R) of 0.146 and weighted average of 6.2%, a difference of 25.9%.
Unemployment Among Seniors over 65 years Correlation Summary
| Measurement | Scandinavian | Immigrants from Armenia |
| Minimum | 2.6% | 0.50% |
| Maximum | 100.0% | 17.4% |
| Range | 97.4% | 16.9% |
| Mean | 14.3% | 6.2% |
| Median | 6.9% | 5.5% |
| Interquartile 25% (IQ1) | 4.8% | 3.9% |
| Interquartile 75% (IQ3) | 11.6% | 7.5% |
| Interquartile Range (IQR) | 6.8% | 3.6% |
| Standard Deviation (Sample) | 21.3% | 3.4% |
| Standard Deviation (Population) | 20.9% | 3.3% |
Similar Demographics by Unemployment Among Seniors over 65 years
Demographics Similar to Scandinavians by Unemployment Among Seniors over 65 years
In terms of unemployment among seniors over 65 years, the demographic groups most similar to Scandinavians are Danish (4.9%, a difference of 0.010%), Carpatho Rusyn (4.9%, a difference of 0.060%), European (4.9%, a difference of 0.11%), Immigrants from Iraq (4.9%, a difference of 0.12%), and Immigrants from Sudan (4.9%, a difference of 0.18%).
| Demographics | Rating | Rank | Unemployment Among Seniors over 65 years |
| Scotch-Irish | 99.9 /100 | #51 | Exceptional 4.9% |
| Swedes | 99.9 /100 | #52 | Exceptional 4.9% |
| Immigrants | Sudan | 99.8 /100 | #53 | Exceptional 4.9% |
| Immigrants | Iraq | 99.8 /100 | #54 | Exceptional 4.9% |
| Europeans | 99.8 /100 | #55 | Exceptional 4.9% |
| Carpatho Rusyns | 99.8 /100 | #56 | Exceptional 4.9% |
| Danes | 99.8 /100 | #57 | Exceptional 4.9% |
| Scandinavians | 99.8 /100 | #58 | Exceptional 4.9% |
| Immigrants | Eastern Africa | 99.7 /100 | #59 | Exceptional 4.9% |
| Immigrants | Middle Africa | 99.7 /100 | #60 | Exceptional 4.9% |
| Northern Europeans | 99.7 /100 | #61 | Exceptional 4.9% |
| Latvians | 99.6 /100 | #62 | Exceptional 4.9% |
| Croatians | 99.6 /100 | #63 | Exceptional 4.9% |
| Immigrants | Cambodia | 99.6 /100 | #64 | Exceptional 4.9% |
| Immigrants | Nicaragua | 99.6 /100 | #65 | Exceptional 4.9% |
Demographics Similar to Immigrants from Armenia by Unemployment Among Seniors over 65 years
In terms of unemployment among seniors over 65 years, the demographic groups most similar to Immigrants from Armenia are Tohono O'odham (6.1%, a difference of 0.28%), Pima (6.3%, a difference of 1.8%), Alaska Native (6.3%, a difference of 2.4%), Immigrants from Dominican Republic (6.0%, a difference of 2.5%), and Immigrants from the Azores (6.3%, a difference of 2.5%).
| Demographics | Rating | Rank | Unemployment Among Seniors over 65 years |
| Puerto Ricans | 0.0 /100 | #328 | Tragic 5.9% |
| Dominicans | 0.0 /100 | #329 | Tragic 6.0% |
| Immigrants | Portugal | 0.0 /100 | #330 | Tragic 6.0% |
| Taiwanese | 0.0 /100 | #331 | Tragic 6.0% |
| Aleuts | 0.0 /100 | #332 | Tragic 6.0% |
| Immigrants | Dominican Republic | 0.0 /100 | #333 | Tragic 6.0% |
| Tohono O'odham | 0.0 /100 | #334 | Tragic 6.1% |
| Immigrants | Armenia | 0.0 /100 | #335 | Tragic 6.2% |
| Pima | 0.0 /100 | #336 | Tragic 6.3% |
| Alaska Natives | 0.0 /100 | #337 | Tragic 6.3% |
| Immigrants | Azores | 0.0 /100 | #338 | Tragic 6.3% |
| Paiute | 0.0 /100 | #339 | Tragic 6.3% |
| Ute | 0.0 /100 | #340 | Tragic 6.3% |
| Yakama | 0.0 /100 | #341 | Tragic 6.7% |
| Navajo | 0.0 /100 | #342 | Tragic 6.7% |