Pueblo vs Immigrants from Armenia Unemployment Among Seniors over 65 years
COMPARE
Pueblo
Immigrants from Armenia
Unemployment Among Seniors over 65 years
Unemployment Among Seniors over 65 years Comparison
Pueblo
Immigrants from Armenia
5.4%
UNEMPLOYMENT AMONG SENIORS OVER 65 YEARS
0.1/ 100
METRIC RATING
276th/ 347
METRIC RANK
6.2%
UNEMPLOYMENT AMONG SENIORS OVER 65 YEARS
0.0/ 100
METRIC RATING
335th/ 347
METRIC RANK
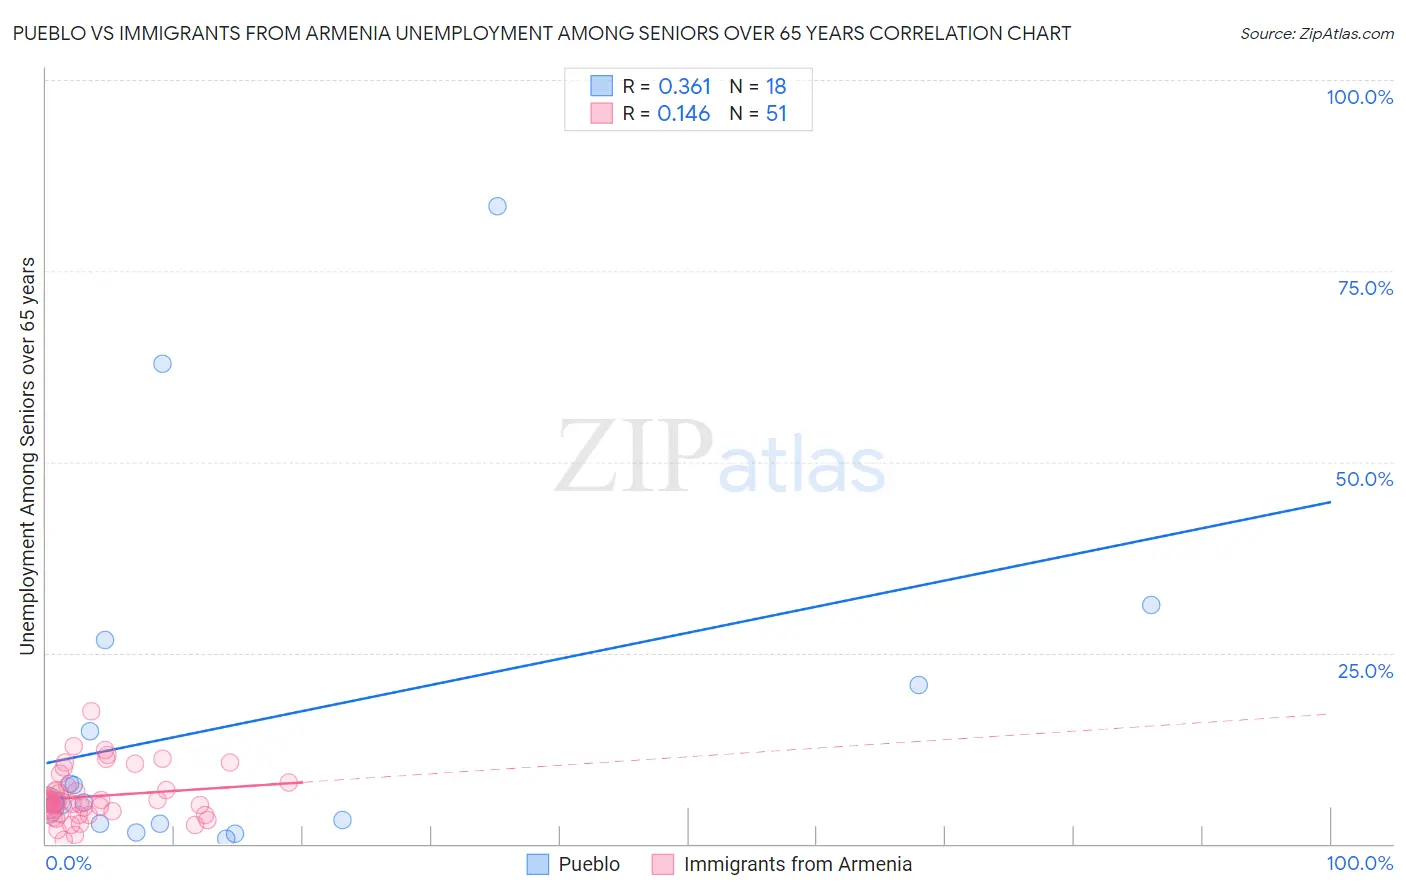
Pueblo vs Immigrants from Armenia Unemployment Among Seniors over 65 years Correlation Chart
The statistical analysis conducted on geographies consisting of 115,365,485 people shows a mild positive correlation between the proportion of Pueblo and unemployment rate amomg seniors over the age of 65 in the United States with a correlation coefficient (R) of 0.361 and weighted average of 5.4%. Similarly, the statistical analysis conducted on geographies consisting of 95,751,905 people shows a poor positive correlation between the proportion of Immigrants from Armenia and unemployment rate amomg seniors over the age of 65 in the United States with a correlation coefficient (R) of 0.146 and weighted average of 6.2%, a difference of 13.2%.
Unemployment Among Seniors over 65 years Correlation Summary
| Measurement | Pueblo | Immigrants from Armenia |
| Minimum | 0.70% | 0.50% |
| Maximum | 83.4% | 17.4% |
| Range | 82.7% | 16.9% |
| Mean | 16.0% | 6.2% |
| Median | 5.4% | 5.5% |
| Interquartile 25% (IQ1) | 2.6% | 3.9% |
| Interquartile 75% (IQ3) | 20.8% | 7.5% |
| Interquartile Range (IQR) | 18.2% | 3.6% |
| Standard Deviation (Sample) | 22.9% | 3.4% |
| Standard Deviation (Population) | 22.2% | 3.3% |
Similar Demographics by Unemployment Among Seniors over 65 years
Demographics Similar to Pueblo by Unemployment Among Seniors over 65 years
In terms of unemployment among seniors over 65 years, the demographic groups most similar to Pueblo are Mexican American Indian (5.4%, a difference of 0.030%), Immigrants from Western Africa (5.4%, a difference of 0.030%), Colville (5.4%, a difference of 0.14%), Immigrants from Brazil (5.4%, a difference of 0.16%), and Immigrants from Nigeria (5.4%, a difference of 0.20%).
| Demographics | Rating | Rank | Unemployment Among Seniors over 65 years |
| Immigrants | Southern Europe | 0.1 /100 | #269 | Tragic 5.4% |
| Immigrants | Morocco | 0.1 /100 | #270 | Tragic 5.4% |
| Cypriots | 0.1 /100 | #271 | Tragic 5.4% |
| Immigrants | Jamaica | 0.1 /100 | #272 | Tragic 5.4% |
| Immigrants | Nigeria | 0.1 /100 | #273 | Tragic 5.4% |
| Immigrants | Brazil | 0.1 /100 | #274 | Tragic 5.4% |
| Mexican American Indians | 0.1 /100 | #275 | Tragic 5.4% |
| Pueblo | 0.1 /100 | #276 | Tragic 5.4% |
| Immigrants | Western Africa | 0.1 /100 | #277 | Tragic 5.4% |
| Colville | 0.1 /100 | #278 | Tragic 5.4% |
| Brazilians | 0.1 /100 | #279 | Tragic 5.5% |
| Immigrants | South America | 0.1 /100 | #280 | Tragic 5.5% |
| Immigrants | Norway | 0.0 /100 | #281 | Tragic 5.5% |
| Immigrants | Belize | 0.0 /100 | #282 | Tragic 5.5% |
| Immigrants | Haiti | 0.0 /100 | #283 | Tragic 5.5% |
Demographics Similar to Immigrants from Armenia by Unemployment Among Seniors over 65 years
In terms of unemployment among seniors over 65 years, the demographic groups most similar to Immigrants from Armenia are Tohono O'odham (6.1%, a difference of 0.28%), Pima (6.3%, a difference of 1.8%), Alaska Native (6.3%, a difference of 2.4%), Immigrants from Dominican Republic (6.0%, a difference of 2.5%), and Immigrants from the Azores (6.3%, a difference of 2.5%).
| Demographics | Rating | Rank | Unemployment Among Seniors over 65 years |
| Puerto Ricans | 0.0 /100 | #328 | Tragic 5.9% |
| Dominicans | 0.0 /100 | #329 | Tragic 6.0% |
| Immigrants | Portugal | 0.0 /100 | #330 | Tragic 6.0% |
| Taiwanese | 0.0 /100 | #331 | Tragic 6.0% |
| Aleuts | 0.0 /100 | #332 | Tragic 6.0% |
| Immigrants | Dominican Republic | 0.0 /100 | #333 | Tragic 6.0% |
| Tohono O'odham | 0.0 /100 | #334 | Tragic 6.1% |
| Immigrants | Armenia | 0.0 /100 | #335 | Tragic 6.2% |
| Pima | 0.0 /100 | #336 | Tragic 6.3% |
| Alaska Natives | 0.0 /100 | #337 | Tragic 6.3% |
| Immigrants | Azores | 0.0 /100 | #338 | Tragic 6.3% |
| Paiute | 0.0 /100 | #339 | Tragic 6.3% |
| Ute | 0.0 /100 | #340 | Tragic 6.3% |
| Yakama | 0.0 /100 | #341 | Tragic 6.7% |
| Navajo | 0.0 /100 | #342 | Tragic 6.7% |