Russian vs Kenyan Unemployment Among Ages 25 to 29 years
COMPARE
Russian
Kenyan
Unemployment Among Ages 25 to 29 years
Unemployment Among Ages 25 to 29 years Comparison
Russians
Kenyans
6.6%
UNEMPLOYMENT AMONG AGES 25 TO 29 YEARS
51.3/ 100
METRIC RATING
173rd/ 347
METRIC RANK
6.3%
UNEMPLOYMENT AMONG AGES 25 TO 29 YEARS
98.0/ 100
METRIC RATING
63rd/ 347
METRIC RANK
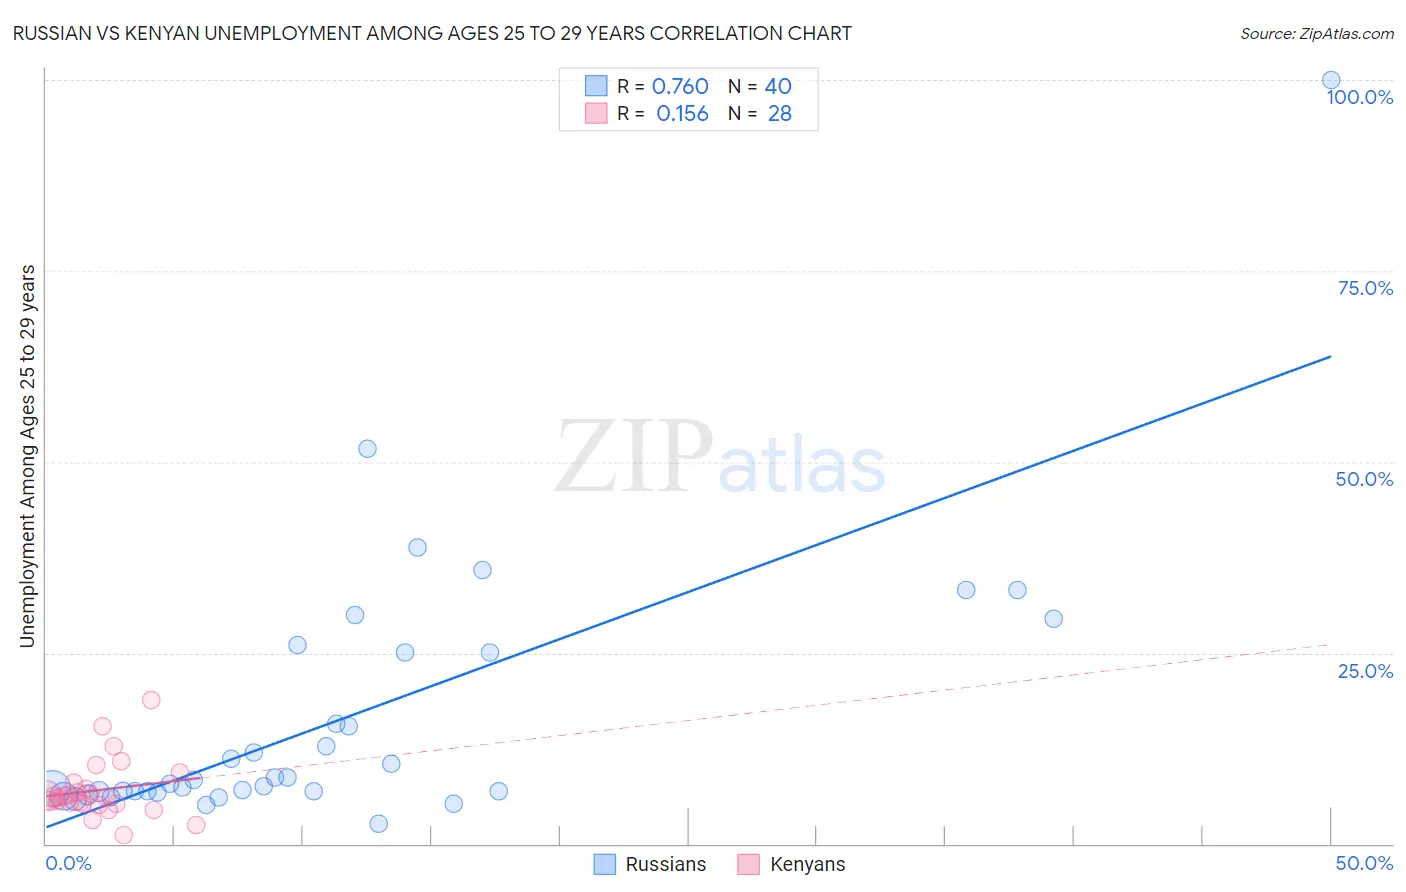
Russian vs Kenyan Unemployment Among Ages 25 to 29 years Correlation Chart
The statistical analysis conducted on geographies consisting of 468,496,515 people shows a strong positive correlation between the proportion of Russians and unemployment rate among population between the ages 25 and 29 in the United States with a correlation coefficient (R) of 0.760 and weighted average of 6.6%. Similarly, the statistical analysis conducted on geographies consisting of 165,555,949 people shows a poor positive correlation between the proportion of Kenyans and unemployment rate among population between the ages 25 and 29 in the United States with a correlation coefficient (R) of 0.156 and weighted average of 6.3%, a difference of 6.3%.
Unemployment Among Ages 25 to 29 years Correlation Summary
| Measurement | Russian | Kenyan |
| Minimum | 2.7% | 1.2% |
| Maximum | 100.0% | 18.8% |
| Range | 97.3% | 17.6% |
| Mean | 16.5% | 7.0% |
| Median | 8.1% | 6.1% |
| Interquartile 25% (IQ1) | 6.8% | 5.2% |
| Interquartile 75% (IQ3) | 25.0% | 7.6% |
| Interquartile Range (IQR) | 18.2% | 2.4% |
| Standard Deviation (Sample) | 18.0% | 3.8% |
| Standard Deviation (Population) | 17.7% | 3.7% |
Similar Demographics by Unemployment Among Ages 25 to 29 years
Demographics Similar to Russians by Unemployment Among Ages 25 to 29 years
In terms of unemployment among ages 25 to 29 years, the demographic groups most similar to Russians are Bangladeshi (6.6%, a difference of 0.020%), Immigrants from Cambodia (6.6%, a difference of 0.080%), Immigrants from North America (6.6%, a difference of 0.080%), Immigrants from South Eastern Asia (6.7%, a difference of 0.13%), and Albanian (6.6%, a difference of 0.14%).
| Demographics | Rating | Rank | Unemployment Among Ages 25 to 29 years |
| Immigrants | Northern Europe | 57.3 /100 | #166 | Average 6.6% |
| Immigrants | Canada | 55.0 /100 | #167 | Average 6.6% |
| Estonians | 54.8 /100 | #168 | Average 6.6% |
| South Americans | 54.5 /100 | #169 | Average 6.6% |
| Albanians | 53.5 /100 | #170 | Average 6.6% |
| Immigrants | Cambodia | 52.6 /100 | #171 | Average 6.6% |
| Bangladeshis | 51.6 /100 | #172 | Average 6.6% |
| Russians | 51.3 /100 | #173 | Average 6.6% |
| Immigrants | North America | 50.0 /100 | #174 | Average 6.6% |
| Immigrants | South Eastern Asia | 49.1 /100 | #175 | Average 6.7% |
| Osage | 48.1 /100 | #176 | Average 6.7% |
| Immigrants | Israel | 47.8 /100 | #177 | Average 6.7% |
| Immigrants | Iraq | 45.1 /100 | #178 | Average 6.7% |
| Costa Ricans | 44.9 /100 | #179 | Average 6.7% |
| Immigrants | Africa | 41.1 /100 | #180 | Average 6.7% |
Demographics Similar to Kenyans by Unemployment Among Ages 25 to 29 years
In terms of unemployment among ages 25 to 29 years, the demographic groups most similar to Kenyans are Immigrants from Sri Lanka (6.3%, a difference of 0.050%), Immigrants from China (6.2%, a difference of 0.070%), Immigrants from Lebanon (6.3%, a difference of 0.10%), Indian (Asian) (6.3%, a difference of 0.12%), and Immigrants from Northern Africa (6.3%, a difference of 0.13%).
| Demographics | Rating | Rank | Unemployment Among Ages 25 to 29 years |
| Immigrants | Burma/Myanmar | 98.7 /100 | #56 | Exceptional 6.2% |
| Immigrants | Saudi Arabia | 98.6 /100 | #57 | Exceptional 6.2% |
| Immigrants | Eastern Asia | 98.4 /100 | #58 | Exceptional 6.2% |
| Luxembourgers | 98.3 /100 | #59 | Exceptional 6.2% |
| Immigrants | Taiwan | 98.3 /100 | #60 | Exceptional 6.2% |
| Bhutanese | 98.2 /100 | #61 | Exceptional 6.2% |
| Immigrants | China | 98.1 /100 | #62 | Exceptional 6.2% |
| Kenyans | 98.0 /100 | #63 | Exceptional 6.3% |
| Immigrants | Sri Lanka | 97.9 /100 | #64 | Exceptional 6.3% |
| Immigrants | Lebanon | 97.8 /100 | #65 | Exceptional 6.3% |
| Indians (Asian) | 97.8 /100 | #66 | Exceptional 6.3% |
| Immigrants | Northern Africa | 97.8 /100 | #67 | Exceptional 6.3% |
| Palestinians | 97.7 /100 | #68 | Exceptional 6.3% |
| Immigrants | Hong Kong | 97.5 /100 | #69 | Exceptional 6.3% |
| Immigrants | Malaysia | 97.5 /100 | #70 | Exceptional 6.3% |