Russian vs Ecuadorian Unemployment Among Seniors over 75 years
COMPARE
Russian
Ecuadorian
Unemployment Among Seniors over 75 years
Unemployment Among Seniors over 75 years Comparison
Russians
Ecuadorians
8.9%
UNEMPLOYMENT AMONG SENIORS OVER 75 YEARS
24.1/ 100
METRIC RATING
202nd/ 347
METRIC RANK
8.6%
UNEMPLOYMENT AMONG SENIORS OVER 75 YEARS
78.5/ 100
METRIC RATING
155th/ 347
METRIC RANK
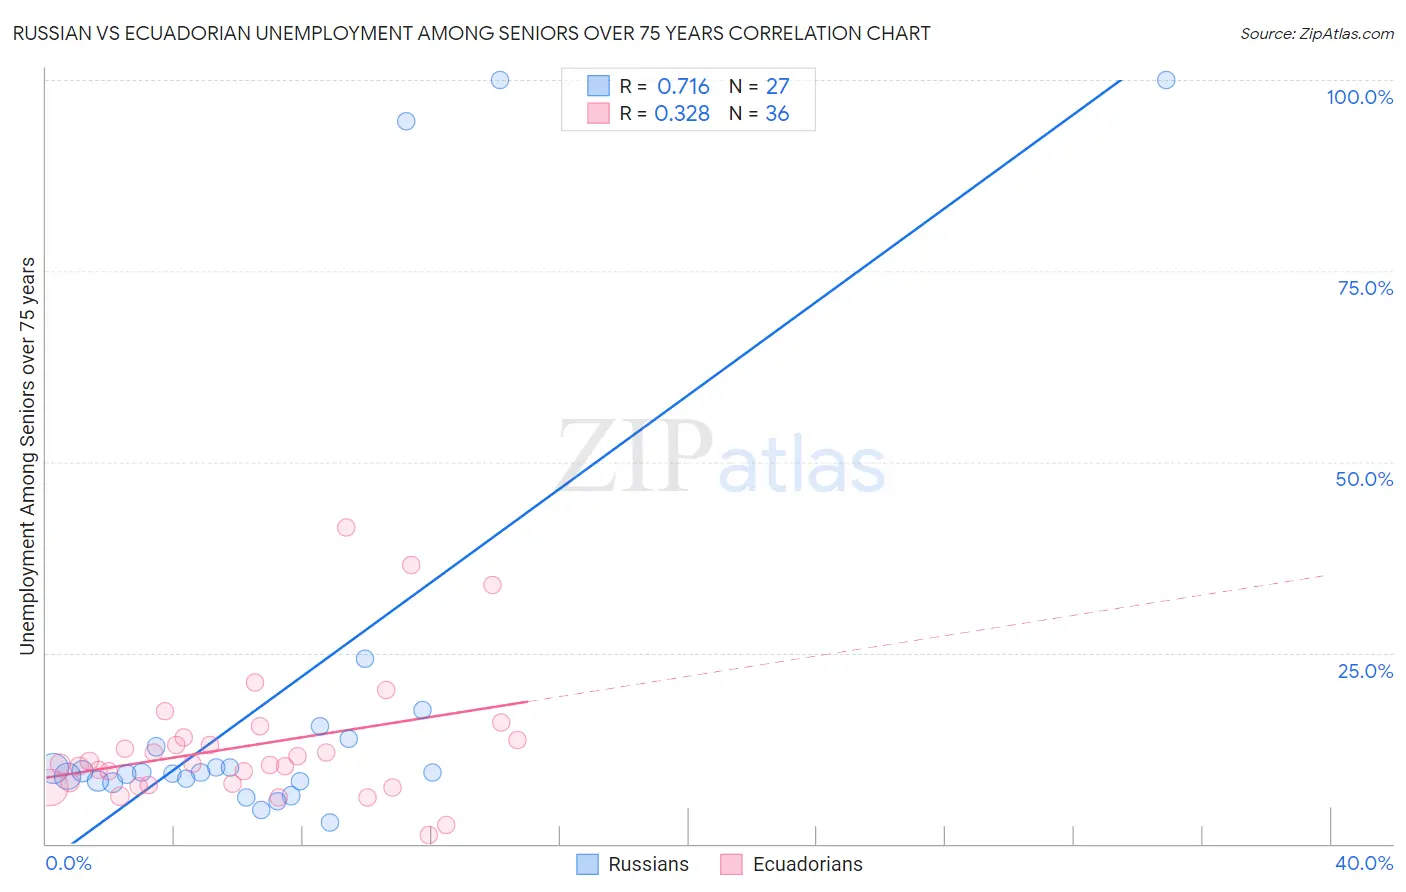
Russian vs Ecuadorian Unemployment Among Seniors over 75 years Correlation Chart
The statistical analysis conducted on geographies consisting of 227,559,855 people shows a strong positive correlation between the proportion of Russians and unemployment rate among seniors over the age of 75 in the United States with a correlation coefficient (R) of 0.716 and weighted average of 8.9%. Similarly, the statistical analysis conducted on geographies consisting of 177,843,833 people shows a mild positive correlation between the proportion of Ecuadorians and unemployment rate among seniors over the age of 75 in the United States with a correlation coefficient (R) of 0.328 and weighted average of 8.6%, a difference of 3.3%.
Unemployment Among Seniors over 75 years Correlation Summary
| Measurement | Russian | Ecuadorian |
| Minimum | 2.8% | 1.1% |
| Maximum | 100.0% | 41.4% |
| Range | 97.2% | 40.3% |
| Mean | 19.7% | 12.8% |
| Median | 9.3% | 10.4% |
| Interquartile 25% (IQ1) | 8.1% | 7.7% |
| Interquartile 75% (IQ3) | 13.7% | 13.8% |
| Interquartile Range (IQR) | 5.6% | 6.0% |
| Standard Deviation (Sample) | 28.6% | 8.6% |
| Standard Deviation (Population) | 28.1% | 8.5% |
Similar Demographics by Unemployment Among Seniors over 75 years
Demographics Similar to Russians by Unemployment Among Seniors over 75 years
In terms of unemployment among seniors over 75 years, the demographic groups most similar to Russians are Immigrants from Peru (8.9%, a difference of 0.010%), Immigrants from Northern Europe (8.9%, a difference of 0.020%), Pakistani (8.9%, a difference of 0.090%), Osage (8.9%, a difference of 0.090%), and Eastern European (8.9%, a difference of 0.12%).
| Demographics | Rating | Rank | Unemployment Among Seniors over 75 years |
| Okinawans | 28.9 /100 | #195 | Fair 8.8% |
| Immigrants | Jamaica | 27.7 /100 | #196 | Fair 8.9% |
| Immigrants | Laos | 26.3 /100 | #197 | Fair 8.9% |
| Eastern Europeans | 25.9 /100 | #198 | Fair 8.9% |
| Pakistanis | 25.4 /100 | #199 | Fair 8.9% |
| Osage | 25.4 /100 | #200 | Fair 8.9% |
| Immigrants | Peru | 24.3 /100 | #201 | Fair 8.9% |
| Russians | 24.1 /100 | #202 | Fair 8.9% |
| Immigrants | Northern Europe | 23.9 /100 | #203 | Fair 8.9% |
| Spaniards | 22.0 /100 | #204 | Fair 8.9% |
| Koreans | 21.9 /100 | #205 | Fair 8.9% |
| Immigrants | Western Europe | 18.2 /100 | #206 | Poor 8.9% |
| Malaysians | 16.3 /100 | #207 | Poor 8.9% |
| Immigrants | Philippines | 15.8 /100 | #208 | Poor 8.9% |
| Salvadorans | 15.4 /100 | #209 | Poor 8.9% |
Demographics Similar to Ecuadorians by Unemployment Among Seniors over 75 years
In terms of unemployment among seniors over 75 years, the demographic groups most similar to Ecuadorians are Immigrants from Pakistan (8.6%, a difference of 0.10%), Mongolian (8.6%, a difference of 0.13%), Immigrants from Bahamas (8.6%, a difference of 0.16%), Latvian (8.6%, a difference of 0.17%), and Turkish (8.6%, a difference of 0.17%).
| Demographics | Rating | Rank | Unemployment Among Seniors over 75 years |
| Immigrants | Colombia | 85.6 /100 | #148 | Excellent 8.5% |
| Immigrants | Ecuador | 84.6 /100 | #149 | Excellent 8.5% |
| Paiute | 82.5 /100 | #150 | Excellent 8.6% |
| Immigrants | Bosnia and Herzegovina | 80.6 /100 | #151 | Excellent 8.6% |
| Latvians | 80.5 /100 | #152 | Excellent 8.6% |
| Mongolians | 80.1 /100 | #153 | Excellent 8.6% |
| Immigrants | Pakistan | 79.7 /100 | #154 | Good 8.6% |
| Ecuadorians | 78.5 /100 | #155 | Good 8.6% |
| Immigrants | Bahamas | 76.5 /100 | #156 | Good 8.6% |
| Turks | 76.4 /100 | #157 | Good 8.6% |
| Ethiopians | 75.3 /100 | #158 | Good 8.6% |
| Shoshone | 74.6 /100 | #159 | Good 8.6% |
| Cree | 72.8 /100 | #160 | Good 8.6% |
| Albanians | 72.8 /100 | #161 | Good 8.6% |
| Immigrants | South America | 71.3 /100 | #162 | Good 8.6% |