Immigrants from Thailand vs Ecuadorian Unemployment Among Seniors over 75 years
COMPARE
Immigrants from Thailand
Ecuadorian
Unemployment Among Seniors over 75 years
Unemployment Among Seniors over 75 years Comparison
Immigrants from Thailand
Ecuadorians
8.8%
UNEMPLOYMENT AMONG SENIORS OVER 75 YEARS
40.2/ 100
METRIC RATING
181st/ 347
METRIC RANK
8.6%
UNEMPLOYMENT AMONG SENIORS OVER 75 YEARS
78.5/ 100
METRIC RATING
155th/ 347
METRIC RANK
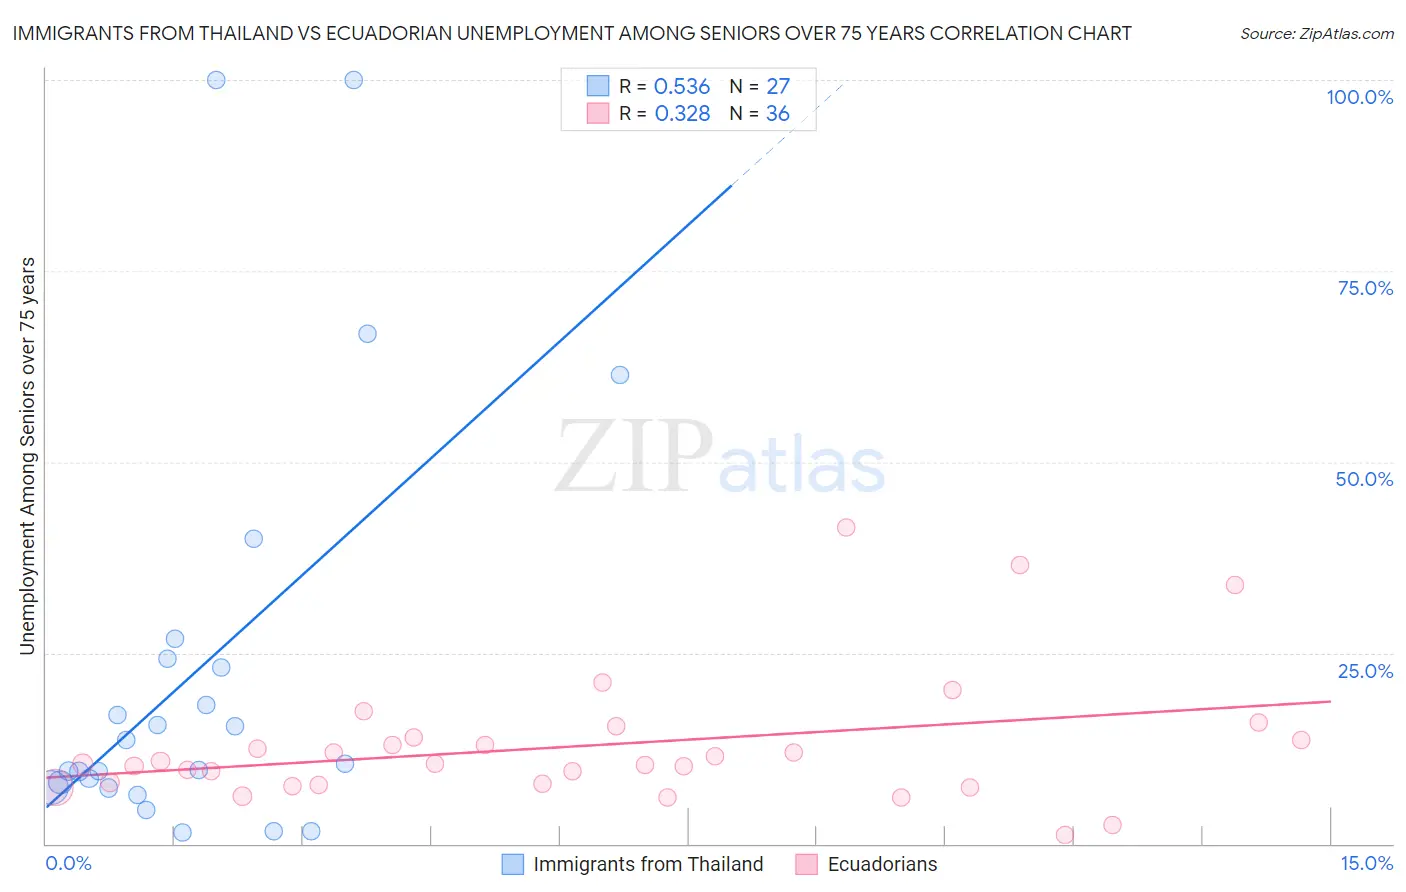
Immigrants from Thailand vs Ecuadorian Unemployment Among Seniors over 75 years Correlation Chart
The statistical analysis conducted on geographies consisting of 175,094,051 people shows a substantial positive correlation between the proportion of Immigrants from Thailand and unemployment rate among seniors over the age of 75 in the United States with a correlation coefficient (R) of 0.536 and weighted average of 8.8%. Similarly, the statistical analysis conducted on geographies consisting of 177,843,833 people shows a mild positive correlation between the proportion of Ecuadorians and unemployment rate among seniors over the age of 75 in the United States with a correlation coefficient (R) of 0.328 and weighted average of 8.6%, a difference of 2.3%.
Unemployment Among Seniors over 75 years Correlation Summary
| Measurement | Immigrants from Thailand | Ecuadorian |
| Minimum | 1.4% | 1.1% |
| Maximum | 100.0% | 41.4% |
| Range | 98.6% | 40.3% |
| Mean | 22.9% | 12.8% |
| Median | 10.4% | 10.4% |
| Interquartile 25% (IQ1) | 7.3% | 7.7% |
| Interquartile 75% (IQ3) | 24.3% | 13.8% |
| Interquartile Range (IQR) | 17.0% | 6.0% |
| Standard Deviation (Sample) | 27.5% | 8.6% |
| Standard Deviation (Population) | 27.0% | 8.5% |
Similar Demographics by Unemployment Among Seniors over 75 years
Demographics Similar to Immigrants from Thailand by Unemployment Among Seniors over 75 years
In terms of unemployment among seniors over 75 years, the demographic groups most similar to Immigrants from Thailand are Guatemalan (8.8%, a difference of 0.040%), Immigrants from Italy (8.8%, a difference of 0.080%), Immigrants from Somalia (8.8%, a difference of 0.080%), West Indian (8.8%, a difference of 0.090%), and Immigrants from Afghanistan (8.8%, a difference of 0.11%).
| Demographics | Rating | Rank | Unemployment Among Seniors over 75 years |
| Immigrants | El Salvador | 49.7 /100 | #174 | Average 8.7% |
| Syrians | 49.6 /100 | #175 | Average 8.7% |
| Somalis | 45.3 /100 | #176 | Average 8.8% |
| Central Americans | 43.3 /100 | #177 | Average 8.8% |
| West Indians | 41.9 /100 | #178 | Average 8.8% |
| Immigrants | Italy | 41.7 /100 | #179 | Average 8.8% |
| Immigrants | Somalia | 41.7 /100 | #180 | Average 8.8% |
| Immigrants | Thailand | 40.2 /100 | #181 | Average 8.8% |
| Guatemalans | 39.5 /100 | #182 | Fair 8.8% |
| Immigrants | Afghanistan | 38.2 /100 | #183 | Fair 8.8% |
| Immigrants | Micronesia | 37.2 /100 | #184 | Fair 8.8% |
| Choctaw | 37.1 /100 | #185 | Fair 8.8% |
| Immigrants | Ethiopia | 36.2 /100 | #186 | Fair 8.8% |
| Immigrants | Europe | 35.2 /100 | #187 | Fair 8.8% |
| Immigrants | Eastern Europe | 34.7 /100 | #188 | Fair 8.8% |
Demographics Similar to Ecuadorians by Unemployment Among Seniors over 75 years
In terms of unemployment among seniors over 75 years, the demographic groups most similar to Ecuadorians are Immigrants from Pakistan (8.6%, a difference of 0.10%), Mongolian (8.6%, a difference of 0.13%), Immigrants from Bahamas (8.6%, a difference of 0.16%), Latvian (8.6%, a difference of 0.17%), and Turkish (8.6%, a difference of 0.17%).
| Demographics | Rating | Rank | Unemployment Among Seniors over 75 years |
| Immigrants | Colombia | 85.6 /100 | #148 | Excellent 8.5% |
| Immigrants | Ecuador | 84.6 /100 | #149 | Excellent 8.5% |
| Paiute | 82.5 /100 | #150 | Excellent 8.6% |
| Immigrants | Bosnia and Herzegovina | 80.6 /100 | #151 | Excellent 8.6% |
| Latvians | 80.5 /100 | #152 | Excellent 8.6% |
| Mongolians | 80.1 /100 | #153 | Excellent 8.6% |
| Immigrants | Pakistan | 79.7 /100 | #154 | Good 8.6% |
| Ecuadorians | 78.5 /100 | #155 | Good 8.6% |
| Immigrants | Bahamas | 76.5 /100 | #156 | Good 8.6% |
| Turks | 76.4 /100 | #157 | Good 8.6% |
| Ethiopians | 75.3 /100 | #158 | Good 8.6% |
| Shoshone | 74.6 /100 | #159 | Good 8.6% |
| Cree | 72.8 /100 | #160 | Good 8.6% |
| Albanians | 72.8 /100 | #161 | Good 8.6% |
| Immigrants | South America | 71.3 /100 | #162 | Good 8.6% |