Puerto Rican vs Lumbee Unemployment Among Ages 55 to 59 years
COMPARE
Puerto Rican
Lumbee
Unemployment Among Ages 55 to 59 years
Unemployment Among Ages 55 to 59 years Comparison
Puerto Ricans
Lumbee
7.0%
UNEMPLOYMENT AMONG AGES 55 TO 59 YEARS
0.0/ 100
METRIC RATING
339th/ 347
METRIC RANK
4.9%
UNEMPLOYMENT AMONG AGES 55 TO 59 YEARS
22.5/ 100
METRIC RATING
202nd/ 347
METRIC RANK
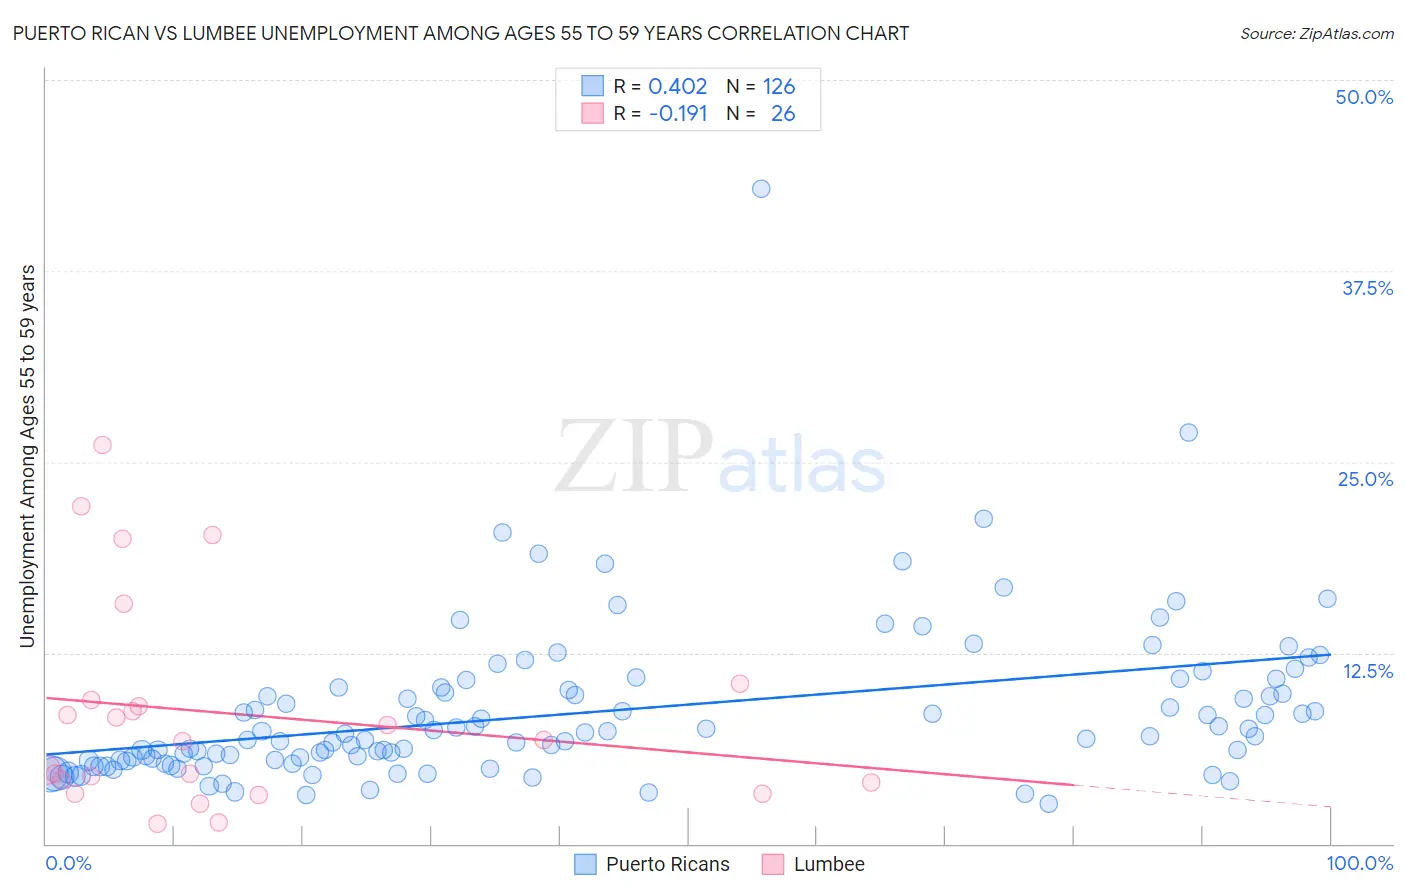
Puerto Rican vs Lumbee Unemployment Among Ages 55 to 59 years Correlation Chart
The statistical analysis conducted on geographies consisting of 468,874,037 people shows a moderate positive correlation between the proportion of Puerto Ricans and unemployment rate among population between the ages 55 and 59 in the United States with a correlation coefficient (R) of 0.402 and weighted average of 7.0%. Similarly, the statistical analysis conducted on geographies consisting of 88,900,260 people shows a poor negative correlation between the proportion of Lumbee and unemployment rate among population between the ages 55 and 59 in the United States with a correlation coefficient (R) of -0.191 and weighted average of 4.9%, a difference of 42.7%.
Unemployment Among Ages 55 to 59 years Correlation Summary
| Measurement | Puerto Rican | Lumbee |
| Minimum | 2.6% | 1.3% |
| Maximum | 42.9% | 26.1% |
| Range | 40.3% | 24.8% |
| Mean | 8.6% | 8.5% |
| Median | 7.0% | 6.8% |
| Interquartile 25% (IQ1) | 5.4% | 4.0% |
| Interquartile 75% (IQ3) | 10.1% | 9.4% |
| Interquartile Range (IQR) | 4.7% | 5.4% |
| Standard Deviation (Sample) | 5.2% | 6.8% |
| Standard Deviation (Population) | 5.2% | 6.6% |
Similar Demographics by Unemployment Among Ages 55 to 59 years
Demographics Similar to Puerto Ricans by Unemployment Among Ages 55 to 59 years
In terms of unemployment among ages 55 to 59 years, the demographic groups most similar to Puerto Ricans are Immigrants from Yemen (6.9%, a difference of 1.1%), Alaskan Athabascan (7.1%, a difference of 2.5%), Paiute (6.8%, a difference of 3.0%), Navajo (6.7%, a difference of 3.6%), and Colville (6.7%, a difference of 3.7%).
| Demographics | Rating | Rank | Unemployment Among Ages 55 to 59 years |
| Aleuts | 0.0 /100 | #332 | Tragic 6.4% |
| Pima | 0.0 /100 | #333 | Tragic 6.6% |
| Pueblo | 0.0 /100 | #334 | Tragic 6.7% |
| Colville | 0.0 /100 | #335 | Tragic 6.7% |
| Navajo | 0.0 /100 | #336 | Tragic 6.7% |
| Paiute | 0.0 /100 | #337 | Tragic 6.8% |
| Immigrants | Yemen | 0.0 /100 | #338 | Tragic 6.9% |
| Puerto Ricans | 0.0 /100 | #339 | Tragic 7.0% |
| Alaskan Athabascans | 0.0 /100 | #340 | Tragic 7.1% |
| Shoshone | 0.0 /100 | #341 | Tragic 7.4% |
| Hopi | 0.0 /100 | #342 | Tragic 8.1% |
| Yakama | 0.0 /100 | #343 | Tragic 8.9% |
| Inupiat | 0.0 /100 | #344 | Tragic 9.0% |
| Tohono O'odham | 0.0 /100 | #345 | Tragic 9.3% |
| Menominee | 0.0 /100 | #346 | Tragic 10.5% |
Demographics Similar to Lumbee by Unemployment Among Ages 55 to 59 years
In terms of unemployment among ages 55 to 59 years, the demographic groups most similar to Lumbee are Immigrants from South America (4.9%, a difference of 0.030%), Basque (4.9%, a difference of 0.050%), Immigrants from Russia (4.9%, a difference of 0.070%), Guamanian/Chamorro (4.9%, a difference of 0.10%), and Immigrants from Philippines (4.9%, a difference of 0.20%).
| Demographics | Rating | Rank | Unemployment Among Ages 55 to 59 years |
| Estonians | 27.2 /100 | #195 | Fair 4.9% |
| Eastern Europeans | 26.7 /100 | #196 | Fair 4.9% |
| Macedonians | 26.4 /100 | #197 | Fair 4.9% |
| Immigrants | Philippines | 26.1 /100 | #198 | Fair 4.9% |
| Immigrants | Russia | 23.7 /100 | #199 | Fair 4.9% |
| Basques | 23.3 /100 | #200 | Fair 4.9% |
| Immigrants | South America | 23.1 /100 | #201 | Fair 4.9% |
| Lumbee | 22.5 /100 | #202 | Fair 4.9% |
| Guamanians/Chamorros | 20.8 /100 | #203 | Fair 4.9% |
| Immigrants | Latvia | 18.5 /100 | #204 | Poor 4.9% |
| Haitians | 18.1 /100 | #205 | Poor 4.9% |
| Immigrants | Belarus | 14.1 /100 | #206 | Poor 4.9% |
| Immigrants | Australia | 14.1 /100 | #207 | Poor 4.9% |
| Immigrants | Kazakhstan | 14.0 /100 | #208 | Poor 4.9% |
| Immigrants | Haiti | 13.3 /100 | #209 | Poor 4.9% |