Basque vs Lumbee Unemployment Among Ages 55 to 59 years
COMPARE
Basque
Lumbee
Unemployment Among Ages 55 to 59 years
Unemployment Among Ages 55 to 59 years Comparison
Basques
Lumbee
4.9%
UNEMPLOYMENT AMONG AGES 55 TO 59 YEARS
23.3/ 100
METRIC RATING
200th/ 347
METRIC RANK
4.9%
UNEMPLOYMENT AMONG AGES 55 TO 59 YEARS
22.5/ 100
METRIC RATING
202nd/ 347
METRIC RANK
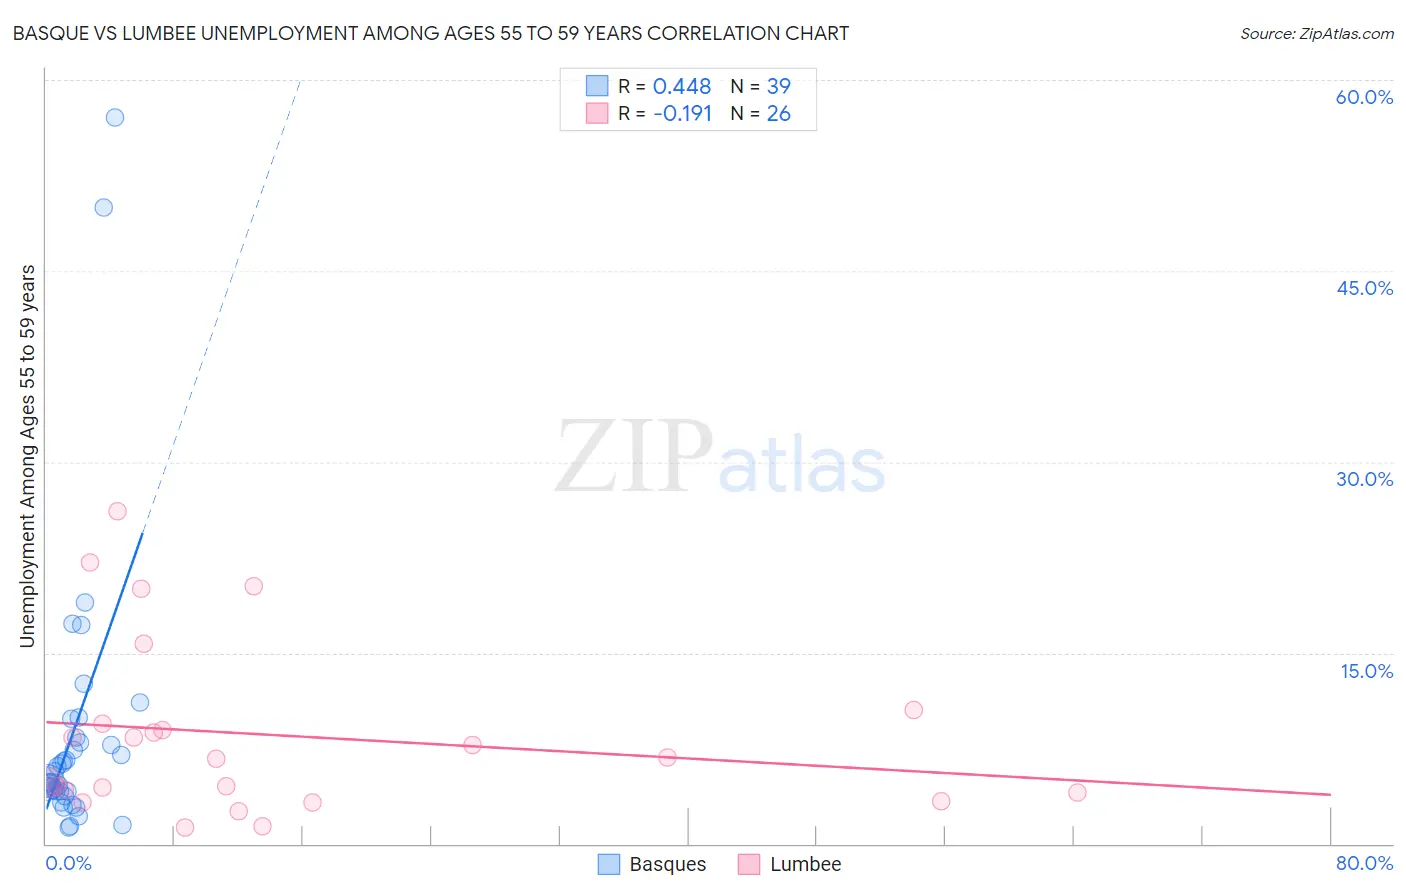
Basque vs Lumbee Unemployment Among Ages 55 to 59 years Correlation Chart
The statistical analysis conducted on geographies consisting of 160,365,130 people shows a moderate positive correlation between the proportion of Basques and unemployment rate among population between the ages 55 and 59 in the United States with a correlation coefficient (R) of 0.448 and weighted average of 4.9%. Similarly, the statistical analysis conducted on geographies consisting of 88,900,260 people shows a poor negative correlation between the proportion of Lumbee and unemployment rate among population between the ages 55 and 59 in the United States with a correlation coefficient (R) of -0.191 and weighted average of 4.9%, a difference of 0.050%.
Unemployment Among Ages 55 to 59 years Correlation Summary
| Measurement | Basque | Lumbee |
| Minimum | 1.2% | 1.3% |
| Maximum | 57.1% | 26.1% |
| Range | 55.9% | 24.8% |
| Mean | 8.8% | 8.5% |
| Median | 4.9% | 6.8% |
| Interquartile 25% (IQ1) | 4.1% | 4.0% |
| Interquartile 75% (IQ3) | 8.3% | 9.4% |
| Interquartile Range (IQR) | 4.2% | 5.4% |
| Standard Deviation (Sample) | 11.4% | 6.8% |
| Standard Deviation (Population) | 11.2% | 6.6% |
Demographics Similar to Basques and Lumbee by Unemployment Among Ages 55 to 59 years
In terms of unemployment among ages 55 to 59 years, the demographic groups most similar to Basques are Immigrants from South America (4.9%, a difference of 0.010%), Immigrants from Russia (4.9%, a difference of 0.020%), Immigrants from Philippines (4.9%, a difference of 0.15%), Guamanian/Chamorro (4.9%, a difference of 0.15%), and Macedonian (4.9%, a difference of 0.17%). Similarly, the demographic groups most similar to Lumbee are Immigrants from South America (4.9%, a difference of 0.030%), Immigrants from Russia (4.9%, a difference of 0.070%), Guamanian/Chamorro (4.9%, a difference of 0.10%), Immigrants from Philippines (4.9%, a difference of 0.20%), and Macedonian (4.9%, a difference of 0.21%).
| Demographics | Rating | Rank | Unemployment Among Ages 55 to 59 years |
| Iranians | 32.4 /100 | #191 | Fair 4.9% |
| Immigrants | Ukraine | 31.7 /100 | #192 | Fair 4.9% |
| Immigrants | Italy | 30.1 /100 | #193 | Fair 4.9% |
| Spaniards | 27.2 /100 | #194 | Fair 4.9% |
| Estonians | 27.2 /100 | #195 | Fair 4.9% |
| Eastern Europeans | 26.7 /100 | #196 | Fair 4.9% |
| Macedonians | 26.4 /100 | #197 | Fair 4.9% |
| Immigrants | Philippines | 26.1 /100 | #198 | Fair 4.9% |
| Immigrants | Russia | 23.7 /100 | #199 | Fair 4.9% |
| Basques | 23.3 /100 | #200 | Fair 4.9% |
| Immigrants | South America | 23.1 /100 | #201 | Fair 4.9% |
| Lumbee | 22.5 /100 | #202 | Fair 4.9% |
| Guamanians/Chamorros | 20.8 /100 | #203 | Fair 4.9% |
| Immigrants | Latvia | 18.5 /100 | #204 | Poor 4.9% |
| Haitians | 18.1 /100 | #205 | Poor 4.9% |
| Immigrants | Belarus | 14.1 /100 | #206 | Poor 4.9% |
| Immigrants | Australia | 14.1 /100 | #207 | Poor 4.9% |
| Immigrants | Kazakhstan | 14.0 /100 | #208 | Poor 4.9% |
| Immigrants | Haiti | 13.3 /100 | #209 | Poor 4.9% |
| Creek | 12.9 /100 | #210 | Poor 4.9% |
| Hawaiians | 12.8 /100 | #211 | Poor 4.9% |