Pueblo vs Paiute Unemployment Among Ages 60 to 64 years
COMPARE
Pueblo
Paiute
Unemployment Among Ages 60 to 64 years
Unemployment Among Ages 60 to 64 years Comparison
Pueblo
Paiute
6.7%
UNEMPLOYMENT AMONG AGES 60 TO 64 YEARS
0.0/ 100
METRIC RATING
340th/ 347
METRIC RANK
5.8%
UNEMPLOYMENT AMONG AGES 60 TO 64 YEARS
0.0/ 100
METRIC RATING
325th/ 347
METRIC RANK
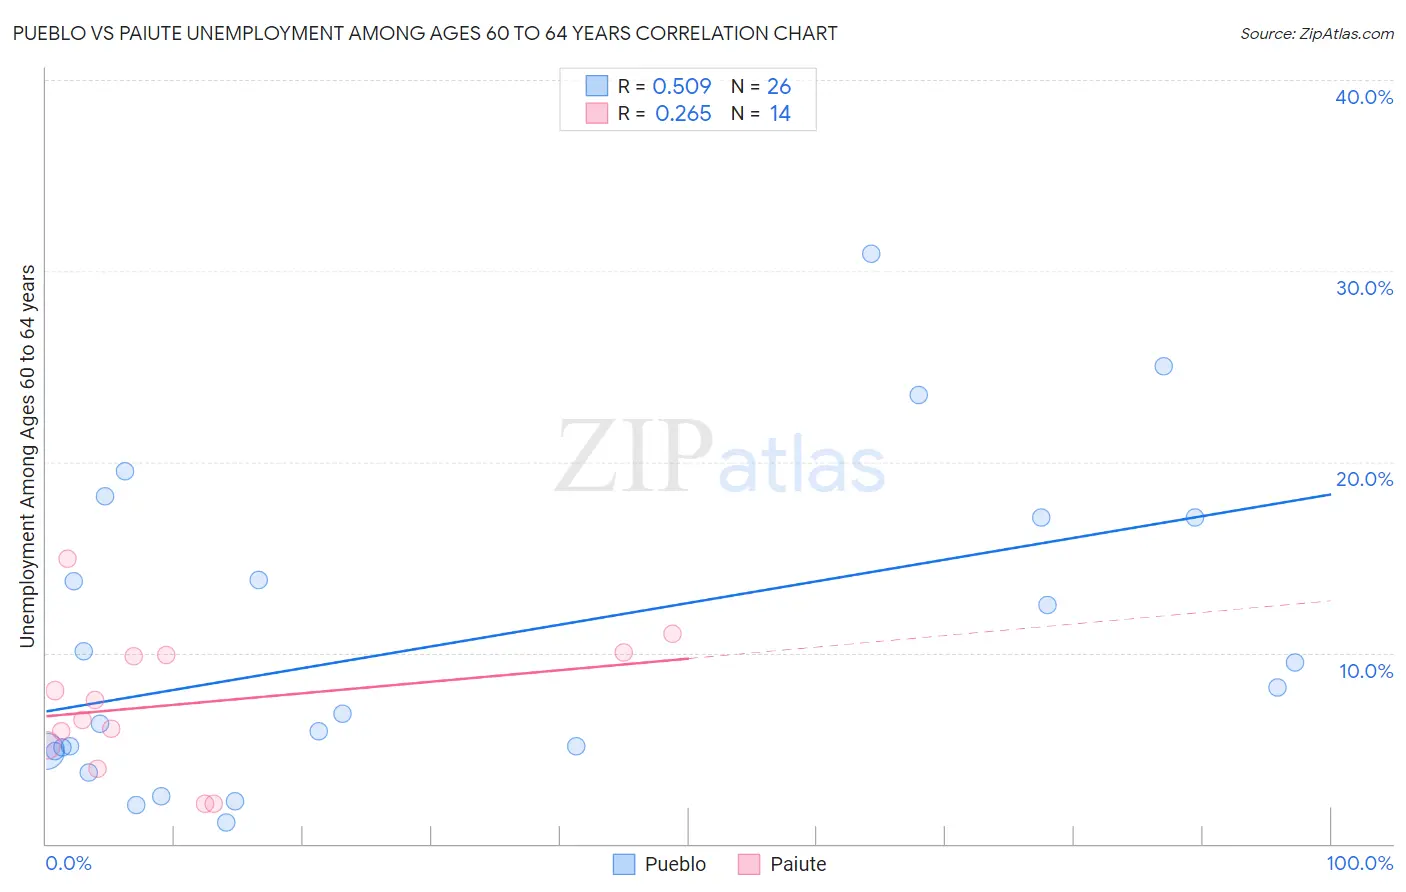
Pueblo vs Paiute Unemployment Among Ages 60 to 64 years Correlation Chart
The statistical analysis conducted on geographies consisting of 115,639,510 people shows a substantial positive correlation between the proportion of Pueblo and unemployment rate among population between the ages 60 and 64 in the United States with a correlation coefficient (R) of 0.509 and weighted average of 6.7%. Similarly, the statistical analysis conducted on geographies consisting of 56,738,721 people shows a weak positive correlation between the proportion of Paiute and unemployment rate among population between the ages 60 and 64 in the United States with a correlation coefficient (R) of 0.265 and weighted average of 5.8%, a difference of 16.0%.
Unemployment Among Ages 60 to 64 years Correlation Summary
| Measurement | Pueblo | Paiute |
| Minimum | 1.1% | 2.1% |
| Maximum | 30.9% | 15.0% |
| Range | 29.8% | 12.9% |
| Mean | 10.6% | 7.3% |
| Median | 7.5% | 7.0% |
| Interquartile 25% (IQ1) | 4.9% | 5.1% |
| Interquartile 75% (IQ3) | 17.1% | 9.9% |
| Interquartile Range (IQR) | 12.2% | 4.7% |
| Standard Deviation (Sample) | 8.0% | 3.6% |
| Standard Deviation (Population) | 7.8% | 3.5% |
Demographics Similar to Pueblo and Paiute by Unemployment Among Ages 60 to 64 years
In terms of unemployment among ages 60 to 64 years, the demographic groups most similar to Pueblo are Yuman (6.8%, a difference of 0.53%), Aleut (6.8%, a difference of 0.54%), Tlingit-Haida (6.4%, a difference of 5.5%), Arapaho (6.3%, a difference of 7.0%), and Navajo (6.3%, a difference of 7.5%). Similarly, the demographic groups most similar to Paiute are Immigrants from Ecuador (5.8%, a difference of 0.010%), Alsatian (5.8%, a difference of 0.35%), Immigrants from St. Vincent and the Grenadines (5.9%, a difference of 0.94%), Ecuadorian (5.8%, a difference of 0.96%), and Immigrants from Grenada (5.9%, a difference of 1.0%).
| Demographics | Rating | Rank | Unemployment Among Ages 60 to 64 years |
| Ecuadorians | 0.0 /100 | #322 | Tragic 5.8% |
| Alsatians | 0.0 /100 | #323 | Tragic 5.8% |
| Immigrants | Ecuador | 0.0 /100 | #324 | Tragic 5.8% |
| Paiute | 0.0 /100 | #325 | Tragic 5.8% |
| Immigrants | St. Vincent and the Grenadines | 0.0 /100 | #326 | Tragic 5.9% |
| Immigrants | Grenada | 0.0 /100 | #327 | Tragic 5.9% |
| Apache | 0.0 /100 | #328 | Tragic 6.0% |
| Immigrants | Bangladesh | 0.0 /100 | #329 | Tragic 6.0% |
| Immigrants | Armenia | 0.0 /100 | #330 | Tragic 6.0% |
| Yakama | 0.0 /100 | #331 | Tragic 6.0% |
| Dominicans | 0.0 /100 | #332 | Tragic 6.0% |
| Immigrants | Dominican Republic | 0.0 /100 | #333 | Tragic 6.0% |
| Puerto Ricans | 0.0 /100 | #334 | Tragic 6.1% |
| Vietnamese | 0.0 /100 | #335 | Tragic 6.1% |
| Kiowa | 0.0 /100 | #336 | Tragic 6.2% |
| Navajo | 0.0 /100 | #337 | Tragic 6.3% |
| Arapaho | 0.0 /100 | #338 | Tragic 6.3% |
| Tlingit-Haida | 0.0 /100 | #339 | Tragic 6.4% |
| Pueblo | 0.0 /100 | #340 | Tragic 6.7% |
| Yuman | 0.0 /100 | #341 | Tragic 6.8% |
| Aleuts | 0.0 /100 | #342 | Tragic 6.8% |